2009 SOUTHEASTERN NATURALIST 8(2):363–374
Site Characteristics and Prey Abundance at Foraging Sites
Used by Lesser Scaup (Aythya affinis) Wintering in Florida
Garth Herring1, 2,* and Jaime A. Collazo1
Abstract - We examined site characteristics and prey abundances where wintering
Aythya affinis (Lesser Scaup; hereafter scaup) foraged within three regions of the Indian
River Lagoon system in central Florida. We observed that scaup concentrated in
the Indian and Banana rivers; however, density of prey items did not differ between
foraging sites and random sites. We also found that site characteristics were similar
between foraging and random sites. Differences in site characteristics between
random points across all three regions did not explain the distribution of foraging
scaup (no scaup foraged in the Mosquito Lagoon); however, prey densities were
approximately 3 times lower in the Mosquito Lagoon region. Our study suggests
that current habitat conditions within the northern Indian River Lagoon system meet
the overwintering requirements of scaup; however, prey densities in the Mosquito
Lagoon may have been too low to be profitable for foraging scaup during the period
of our study.
Introduction
Understanding how avian species distribute themselves is fundamental
to understanding the use and significance of habitats throughout the annual
cycle. For example, during the breeding season many birds must locate highquality
foraging patches to accumulate nutrient reserves for breeding and
brood rearing (see Afton and Ankney 1991, Alisauskas et al. 1990, Ankney
and Afton 1988). Energetic demands of birds are not as high during the winter
season; consequently, birds may only need to sustain a level of condition
that allows them to survive and then initiate spring migration. Regardless
of lower physiological requirements of birds during the wintering period,
individuals still need to select foraging patches that allow them to acquire
sufficient food resources for each day during the entire wintering period.
For many species, the importance of habitat conditions on wintering sites
remains poorly understood, and may well be an important consideration for
conservation efforts, particularly for species that have demonstrated longterm
declines.
The combined continental population of Aythya affinis (Eyton) (Lesser
Scaup) and A. marila (L.) (Greater Scaup) has declined since the late-1970s
(Afton and Anderson 2001, Austin et al. 2000, US Fish and Wildlife Service
2008) and currently is below the North American Waterfowl Management
Plan goals (US Fish and Wildlife Service 2008). Afton and Anderson (2001)
1US Geological Survey, North Carolina Cooperative Fish and Wildlife Research Unit,
North Carolina State University, Raleigh, NC 27695. 2Current Address - US Geological
Survey, Western Ecological Research Center, Davis Field Station, One Shields
Avenue, University of California, Davis, CA 95616. USA*Corresponding author -
gherring@ucdavis.edu.
364 Southeastern Naturalist Vol. 8, No. 2
concluded that the long-term population decline was due to a decline in
Lesser Scaup. Population and habitat trends underscore the importance of
identifying habitat characteristics that provide sufficient energetic needs and
pre-migratory nutrient reserves on wintering grounds. While studies have
suggested that habitat conditions on wintering grounds currently may be
sufficient to meet wintering requirements of scaup (see Herring and Collazo
2004, 2005, 2006), understanding exactly what those habitat conditions are
now is critical so that they can be used as a benchmark for potential future
impacts that may infl uence wintering scaup.
The Indian River Lagoon system (IRL) of central Florida provides
overwintering habitat for approximately 15% of the continental population
(Austin et al. 1998, Bellrose 1980). Yet, despite its importance, there are no
available data on foraging-site characteristics or quality across the IRL system
(e.g., density of scaup prey items). Data on foraging-site characteristics could
aid in understanding underlying factors that might infl uence wintering scaup
foraging-site selection and the biological processes that might infl uence the
quality of foraging sites. Our objectives were to: 1) estimate potential scaup
prey densities throughout the northern IRL system, 2) compare prey densities
at sites used by foraging scaup and those we selected randomly, 3) determine
if foraging sites have unique attributes (i.e., depth, vegetation structure) that
might help scaup identify them as higher quality sites, and 4) assess diet of
wintering scaup to verify our prey-density findings.
Study Area
We conducted our research at Merritt Island National Wildlife Refuge
(MINWR) during the winter of 2001 (Fig. 1). The refuge is located
on the Atlantic Coast approximately 1 km east of Titusville, FL (28°40'N,
80°46'W). The refuge envelops the John F. Kennedy Space Center on Merritt
Island, covering 55,039 ha of the National Aeronautical and Space
Administration’s 57,000 ha in Brevard and Volusia counties. Our study area
was part of the Indian River Lagoon (IRL), a series of three distinct, but interconnected,
estuarine systems, which extend 250 km from Ponce Inlet to
Jupiter Inlet on Florida’s east coast. The IRL includes the waters of the Indian
and Banana rivers and the Mosquito Lagoon. We focused our study in the
northern IRL, covering approximately 25% of the IRL from State Road 528
north in the Indian and Banana rivers, and the southern half of the Mosquito
Lagoon (Fig. 1).
Merritt Island proper is a barrier island complex separated from the mainland
by the Indian River and from Cape Canaveral by the northern Banana
River. The island is composed of sandy beaches, dune systems, hammocks,
lagoons, and 72 salt marsh impoundments jointly managed by the Brevard
Mosquito Control District, National Park Service, NASA, and US Fish
and Wildlife Service. IRL waters tend to be shallow, aeolian lagoons with
depths averaging 1.5 m (maximum = 9 m in dredged areas). Accordingly,
depths throughout our study are consistent with suitable foraging depths for
2009 G. Herring and J.A. Callazo 365
Lesser Scaup (Austin et al. 1998, Bellrose 1980). Salinities range from 10 to
42 ppt (Provancha and Sheidt 2000). Estuarine wetland habitats within our
study site covered approximately 400 km2. Common macrophytes included
Halodule wrightii Aschers (Shoal Grass), Syringodium filiforme Kuetz
(Manatee Grass), Halophila engelmannii Aschers (Star Grass), Halophila
decipiens Ostenf (Paddle Grass), and Ruppia maritime L. (Widgeon Grass)
(Virnstein and Carbonara 1985).
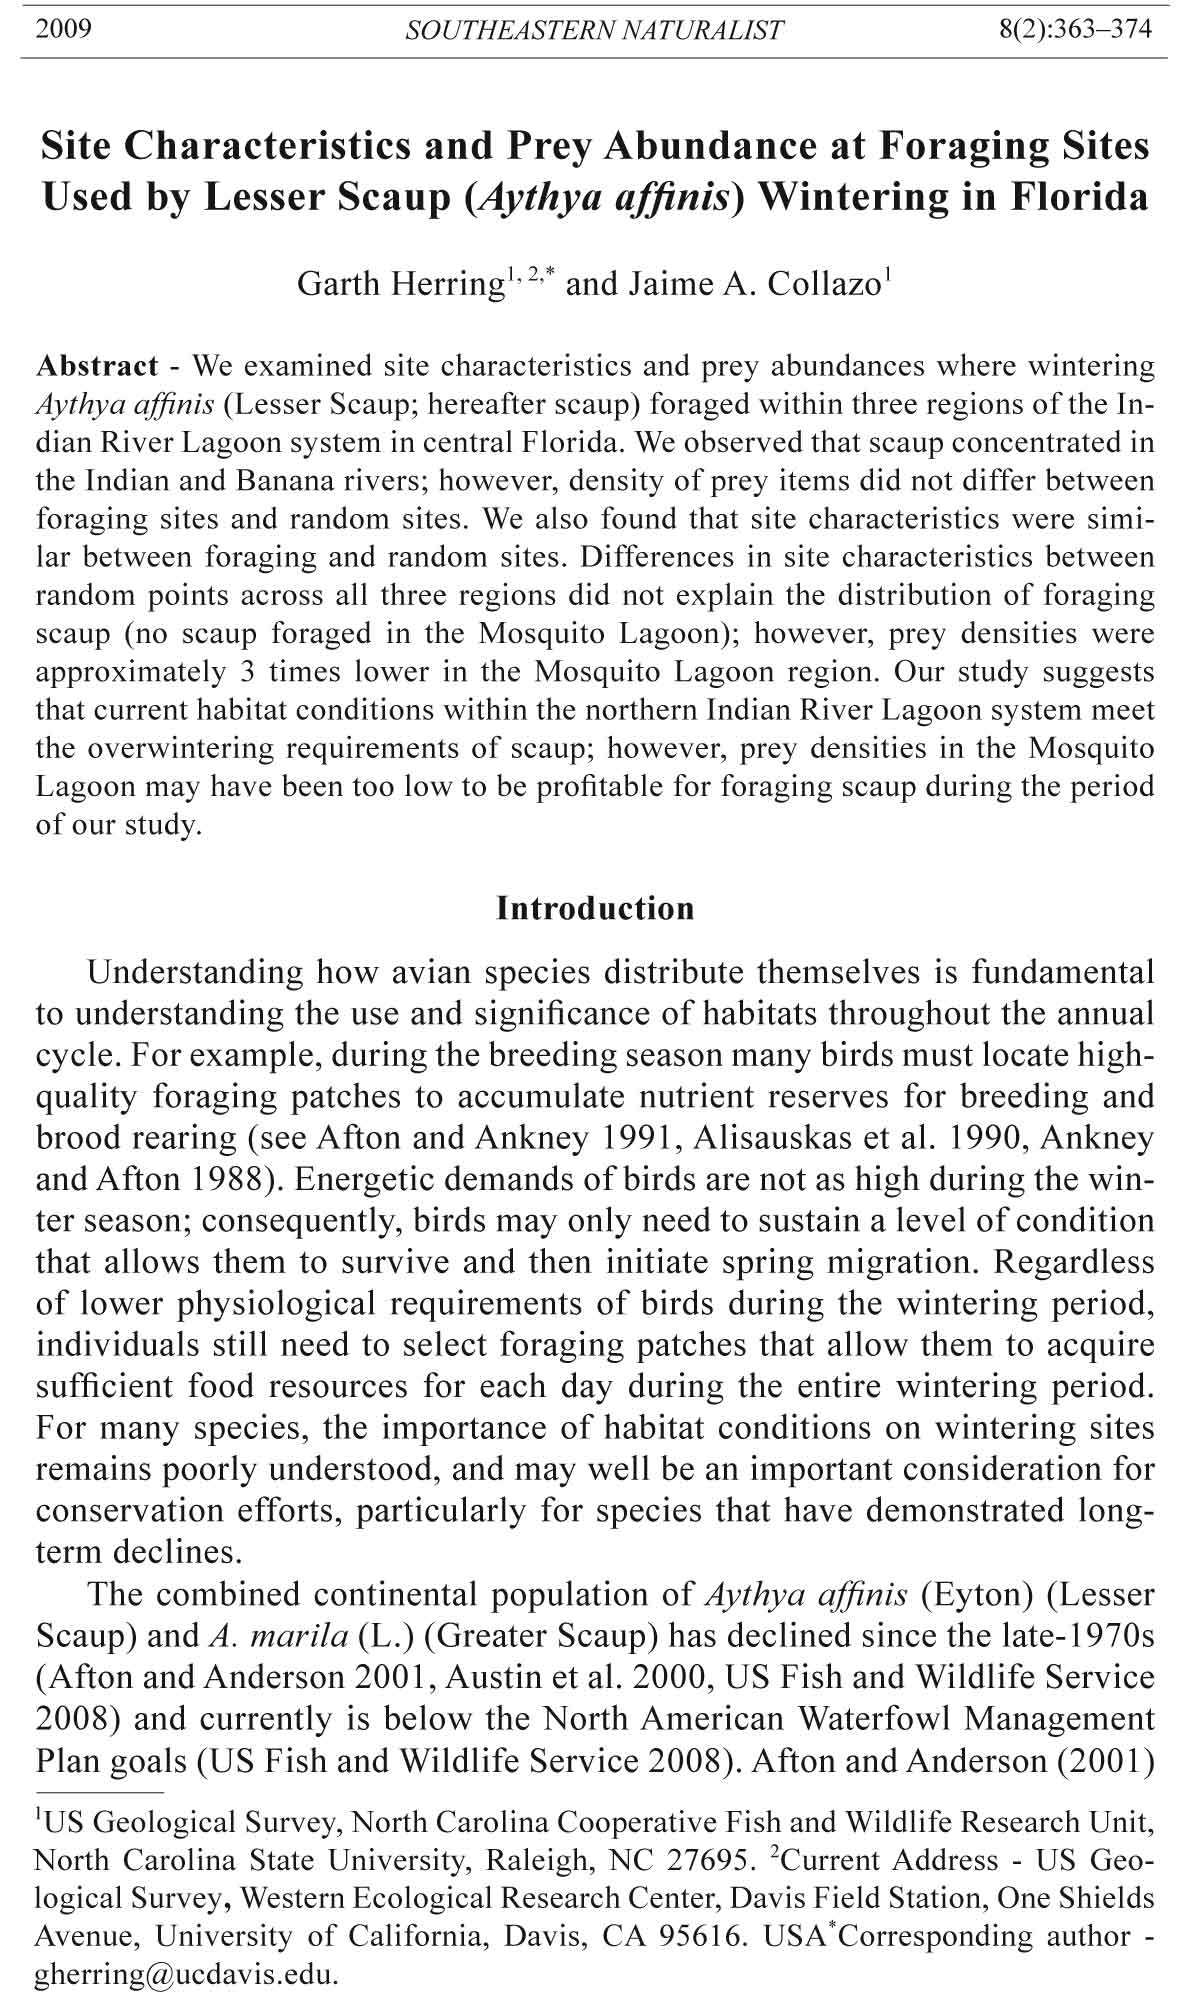
Figure 1. Location of the Lesser Scaup foraging (star) and random sites (asterisk),
and whole-bird collection sites (×) in the northern Indian River Lagoon system, FL in
2001. Map shows the Merritt Island National Wildlife Refuge, and the three estuary
systems: Indian River, Mosquito Lagoon, and Banana River.
366 Southeastern Naturalist Vol. 8, No. 2
Methods
Scaup foraging sites
We identified scaup foraging sites using aerial surveys conducted from
a Bell 212 (UH-1N) helicopter at an altitude of 150 m and speed of 100
km/hr. We flew surveys approximately every 3 weeks, between 21 December
2000 and 8 March 2001 (n = 5), coinciding with the period scaup
were observed on our study area. We began surveys at 0800 hr because
scaup routinely foraged during the morning at all sites surveyed (Herring
and Collazo 2005). The area surveyed included most of the highest
scaup-use areas in the IRL region (Herring and Collazo 2005). Specifically,
we covered all open estuarine regions of the Mosquito Lagoon, Banana
River north of SR 528, and Indian River north of SR 528, using east–west
transects approximately 3 km apart (Fig. 1); we alternated flight direction
on transects for each survey.
We estimated numbers of foraging scaup and recorded their locations
during surveys; GPS coordinates were determined for the center of observed
fl ocks. We considered only scaup fl ocks in which ≥50% of individuals were
observed diving as the helicopter approached. The normal response of scaup
to disturbance was fl ight rather than diving; thus, we are confident that
fl eeing scaup were not confused with feeding scaup. Scaup at MINWR frequently
used the deeper habitats of the IRL, requiring diving to feed (Herring
and Collazo 2005, 2006). Flock size encountered during surveys averaged
1094 ± 89 SE (range = 7–4180). We arbitrarily chose to collect data at foraging
sites from scaup fl ocks with ≥500 birds. Flocks of this size were scattered
over an area of approximately 200 m by 200 m. The location and dimension
of these foraging groups was our primary sampling unit (site).
Site characteristics
We measured vegetation characteristics, water depth, and prey communities
at all sites (n = 19) within one week of the aerial surveys. At each site, we
collected data at five locations using self-contained underwater breathing
apparatus (SCUBA). The first sample point was located at the center point of
the fl ock, based on the GPS coordinates from the aerial survey; the remaining
four sampling points were located 100 m in each of the four cardinal directions
from the center point. We used a 1-m2 sampling frame subdivided into
10-cm2 quadrats at each of the five locations at a foraging site. We lowered
the 1-m2 sampling frame to the bottom at each site, aligning the west side of
the quadrat in a north–south direction using a dive compass. We recorded
the depth at the sampling sites by lowering a weighted measuring line and
recorded the distance from the water’s surface to the bottom of the water column.
We estimated the percent cover by counting the total number of 10-cm2
plots with submerged aquatic vegetation present. We recorded the average
height (cm) and stem density (shoot count) of vegetation in four randomly
selected 10-cm2 quadrats within the 1-m2 plot. We used mean values to better
estimate site characteristics at the 1-m2 scale.
2009 G. Herring and J.A. Callazo 367
We identified random sampling sites on the same day by traveling 1 km
on a random bearing from the center point of the foraging site. Scaup exhibit
small home ranges during winter (home-range core use = 2.7 km2 ± 0.5
SE), with minimal movement from foraging sites on a daily basis (<3 km;
Herring and Collazo 2005), suggesting that our random sampling sites were
within the area that scaup foraged during a day. If we were unable to travel 1
km in a random direction, we selected another random bearing that met this
criteria. We sampled random site characteristics using the same protocol
as used for foraging sites; paired random and foraging sites were sampled
on the same day. No foraging fl ocks with ≥500 scaup were located in the
Mosquito Lagoon (see results), thus we randomly selected 8 sites to sample
using a geographic information system (Arcview v. 3.3, ESRI, Redlands,
CA); this number is close to the midpoint of the number of fl ocks sampled at
Indian and Banana rivers.
Prey density
We collected 3 random, 5-cm deep × 10-cm diameter cores (392.5 cm3)
at each 1-m2 plot where vegetation was assessed. Core samples included
above-sediment macrophytes and benthos. This depth of benthos was 100%
accessible to scaup and within their normal foraging depth (Richman and
Lovvorn 2004). While core samples included both macrophytes and benthos,
we acknowledge that highly mobile invertebrates (e.g., amphipods) probably
were under sampled, and thus we constrained the analysis and interpretation
to benthic and epibenthic fauna. Scaup diet in the IRL during this study was
predominantly gastropods and bivalves (see Results), so prey-density results
were meaningful during the period of our study.
We strained core samples through a 60-μm sieve and stored them in a
ziplock bag in 95% ethanol. Benthic macroinvertebrates samples were identified (most to species or genus) and counted within two weeks of sampling.
Data were summarized as mean density per core sample at the m2 scale,
and then averaged across the five 1-m2 plots sampled per site, and then
extrapolated to a density/m2 estimate. We did not assess aggregate dry mass
(biomass; Prevett et al. 1979) due to concerns of the high mass of shelled
bivalves biasing the value of species (Custer and Custer 1996).
Scaup diet
To validate that prey items collected for prey-density estimates were in
fact consumed by wintering scaup, we collected scaup (n = 57) at MINWR
by either jump or pass shooting from the open-water areas in the Indian
River, Banana River, and Mosquito Lagoon between 8 January and 3 March
2001. While efforts were made to collect scaup over the entire winter period,
most scaup were collected over a short period (≤1 week) in each of the estuary
sites. We assumed that diet selection varied little over the winter period
given the large amount of available foraging habitat. We injected 95% alcohol
into the esophagus immediately after recovering birds to minimize post
mortem digestion. To avoid biasing results (Afton et al. 1991, Swanson and
368 Southeastern Naturalist Vol. 8, No. 2
Bartonek 1970), we used contents from the esophagus and proventriculus.
Diet samples were identified, enumerated, and summarized as percent occurrence
(Swanson et al. 1974) in scaup foraging sites. All research techniques
were approved by the North Carolina State University, Institutional Animal
Care and Use Committee (Protocol 01-144-0), and conducted under US Fish
and Wildlife Service research permit 773137, and Florida Fish and Wildlife
Conservation Commission, scientific collecting permit WXO1671.
Statistical analyses
Site characteristics. We divided the study period into three 26-day periods
(early: 21 Dec–15 Jan, mid: 16 Jan–10 Feb, late: 11 Feb–8 Mar). We
used a multivariate analysis of variance (MANOVA; JMP 2001) to test for
differences between site types (foraging and random), season (early, mid,
and late), region (Indian River, Banana River), and all interactions for %
plant cover, water depth, plant shoot count, and plant height. Because we
did not locate and subsequently sample scaup foraging sites in the Mosquito
Lagoon, we tested separately for differences in site characteristics at random
sites across all three estuaries using a MANOVA for the above response
variables and main effects and their interactions. This approach allowed us
to examine potential differences across estuaries that we could not detect
based simply on our foraging sites, which were only located in the Indian
and Banana rivers. We dropped interaction terms from final models if they
were found not to be significant.
Prey density. We used a general linear model (GLM; JMP 2001) to
determine if total prey density differed by region, site type (foraging and
random), and season. All data met assumptions of equal variance (Levene’s
test; JMP 2001), and residuals were normally distributed. The critical level
of all statistical tests was set at 0.05. We report least square means with one
standard error (± 1 SE) from our final model, and estimate prey density at
the m2 scale.
Results
Scaup foraging sites
Scaup numbers on our first and last survey were low (250 and 2250, respectively)
and peaked in late January (32,698). Mean number of scaup per survey
was 12,625 ± 6062 SE. We located 19 foraging fl ocks of scaup with ≥500 individuals
in the Banana River (n = 5) and Indian River (n = 14; Fig. 1). Mean fl ock
size was 1094 ± 89 SE. Total cumulative numbers of scaup in the Mosquito Lagoon
never exceeded 100 individuals during the entire study period.
Site characteristics
Foraging and random. We found no effect of site type (MANOVA: F4, 33 =
0.40, P = 0.80) on site characteristics, but did detect a significant effect of region
(MANOVA: F2, 33 = 0.28, P < 0.01) and season (MANOVA: F2, 33 = 3.13,
P < 0.01) on measures of % cover, depth, stem counts, and plant heights.
2009 G. Herring and J.A. Callazo 369
Univariate tests revealed that sites in the Indian River were deeper than the
Banana River, % cover was higher early in the season and was higher in
the Banana River, as were stem counts and shoot heights (Table 1).
Random. We found no effect of season (MANOVA: F8, 36 = 0.1.54, P =
0.171) on site characteristics, but did detect a significant effect of region
(MANOVA: F4, 18 = 29.32, P < 0.01) on measures of % cover, depth, stem
count, and plant height. Univariate tests revealed that % cover was highest
in the Banana River, but was similar between the Indian River and Mosquito
Lagoon (Tables 1, 2). Plant height was higher in the Banana River and Mosquito
Lagoon, while stem densities were highest only in the Banana River
(Tables 1, 2).
Prey density
The three most common prey items collected with core sampling were
Tellina tampaensis (Tampa Tellin; 67% of core samples), Cylichnidae Acteocina
spp. (barrel-bubble snails; 14% of core samples), and Cerithium
muscarum (Fly-specked Cerith; 5% of cores samples). We detected no differences
in prey densities between scaup foraging sites (mean = 2154 m2
± 254 SE) and random sites (mean = 1602 m2 ± 336 SE; F1, 36 = 1.90, P =
0.17). Prey densities were higher in the Indian (mean = 2546 m2 ± 240 SE)
and Banana Rivers (mean = 2312 m2 ± 398 SE) than in the Mosquito Lagoon
(mean = 774 m2 ± 454 SE) (F2, 36 = 5.80, P = 0.006). We failed to detect any
difference in prey densities across the three seasonal periods (F2, 36 = 2.88,
P = 0.07).
Scaup diet
We collected 57 scaup from the Banana River (n = 24), Indian River (n =
14), and Mosquito Lagoon (n = 19); 51 contained diet samples. Diet samples
were evenly split by sex (26 M and 25 F). We recorded 16 different food
items in their esophagus and proventriculus. Invertebrates comprised 99.5%
of all items; the remaining 0.5% was made up of macrophyte seeds and
vegetation parts (Table 3). The most frequent invertebrates consumed were
T. tampaensis (26% occurrence), Assiminea succinea (Atlantic Assiminea;
18% occurrence), and Anomalocardia auberiana (Pointed Venus; 14% occurrence),
accounting for 57% of all prey eaten (Table 3).
Discussion
The similarity of foraging conditions across the Indian and Banana rivers
was underscored by the lack of differences in structural and prey-density
levels between used and potential (random) foraging sites in these two estuaries.
These contrasts also provided an opportunity to gain insights about
foraging-site selection. Our results suggest that vegetation structure and
other physical attributes were not important discriminators of foraging sites
used by scaup. We suspect that lack of differences in prey density was real.
Given that scaup had small core home ranges (mean = 2.7 km2) and moved
short distances during the diel period (mean = 2.7 km; Herring 2004), we
370 Southeastern Naturalist Vol. 8, No. 2
Table 1. Multivariate analysis of variance model results for site characteristics by site type (random
or foraging), region, and season at Lesser Scaup sites during winter 2001 in east-central
Florida. Model results are defined as comparisons between foraging and random sites in the
Indian and Banana rivers and among random sites only in the Indian River, Banana River, and
Mosquito Lagoon.
Source df F P
Foraging and random: Indian and Banana rivers
% cover
Site type 1 0.003 0.95
Region 1 170.7 <0.01
Season 2 5.9 <0.01
Error 33
Total 37
Plant height
Site type 1 0.0005 0.98
Region 1 250.1 <0.01
Season 2 4.1 0.02
Error 33
Total 37
Shoot count
Site type 1 0.04 0.83
Region 1 347.7 <0.01
Season 2 3.5 0.03
Error 33
Total 37
Water depth
Site type 1 0.21 0.64
Region 1 25.3 <0.01
Season 2 1.1 0.33
Error 33
Total 37
Random: Indian River, Banana River, and Mosquito Lagoon
% cover
Region 2 23.18 <0.01
Season 2 0.94 0.40
Error 27
Total 30
Plant height
Region 2 7.38 <0.01
Season 2 1.40 0.26
Error 27
Total 30
Shoot count
Region 2 11.86 <0.01
Season 2 1.44 0.25
Error 27
Total 30
Water depth
Region 2 2.69 0.08
Season 2 0.75 0.47
Error 27
Total 30
2009 G. Herring and J.A. Callazo 371
suspect that the high densities of prey overall likely allowed scaup to remain
within these core patches without depleting the available prey during the
period of this study. It is important to note that our study was limited to one
year; thus, our results have to be tempered with the prospect that in other
years scaup may be able to deplete prey densities at foraging patches.
Alternatively, scaup may have remained at foraging sites until a givingup
density was reached, and then abandoned the sites. If this were the case,
based on chance alone, it might be expected that some of the 19 random
sites, with five independent replicates within, might have had elevated prey
densities simply by chance. However, this was not the case, with estimates
of variance being very similar between random and foraging sites. Further,
while we did not quantitatively record whether scaup were still foraging at
sites or how many (when we sampled scaup), we did frequently observe
foraging scaup near the study foraging sites when we arrived to sample them
(G. Herring, pers. observ.).
Table 2. Least squares mean ± SE of site characteristics: plant cover, shoot height, shoot count,
and water depth at random sites in the Indian and Banana rivers and Mosquito Lagoon, during
winter 2001 in east-central Florida.
Mosquito
Banana River Indian River Lagoon
Foraging and random: Indian and Banana rivers
% cover (± SE) 77.0 ± 8.7 1.0 ± 6.5
Plant height (cm ± SE) 13.7 ± 1.1 1.50 ± 0.8
Shoot count 8.4 ± 0.6 0.2 ± 0.4
Water depth (m ± SE) 1.2 ± 0.8 1.8 ± 0.1
Random: Indian River, Banana River, and Mosquito Lagoon
% cover (± SE) 69.0 ± 13.7 3.0 ± 10.0 21.2 ± 10.8
Plant height (cm ± SE) 8.50 ± 3.3 0.50 ± 2.4 2.96 ± 2.65
Shoot count 6.1 ± 1.8 0.6 ± 1.4 1.5 ± 1.5
Water depth (m ± SE) 1.3 ± 0.3 1.8 ± 0.2 1.6 ± 11.0
Table 3. Summary of Lesser Scaup diets during winter 2001 in the Indian River Lagoon system, FL.
# of items
Food item % occurrence in all scaup
Tellina tampaensis Conrad (Tampa Tellin) 26 95
Assiminea succinea Pfeiffer (Atlantic Assiminea) 18 66
Anomalocardia auberiana d’Orbigny (Pointed Venus) 14 50
Palaemonetes intermedius Holthuis (Grass Shrimp) 9 32
Parastarte triquetra Conrad (Brown Gemclam) 8 30
Cylichnidae Acteocina spp Gray (Barrel-bubble Snail) 8 30
Granulina hadria Dall (Hadria Marginella) 7 27
Cerithium muscarum Say (Fly-specked Cerith) 5 18
Marginella apicina Menke (Common Atlantic Marginella) 4 14
Amphipoda spp. (scuds) 4 15
Astyris lunata Say (Lunar Dovesnail) 1 3
Melongena corona Gmelin (Crown Conch) <1 1
Caecum pulchellum Stimpson (Beautiful Caecum) <1 11
Melampus bidentatus Say (Coffee Bean Snail) <1 1
372 Southeastern Naturalist Vol. 8, No. 2
Differences in prey densities between the infrequently used Mosquito
Lagoon and the continually and heavily used Indian and Banana Rivers appear
to be directly related to prey densities within each area. Overall, prey
densities were approximately 3 times higher in both the Indian and Banana
River estuaries, as compared to Mosquito Lagoon. Again, it is important to
note that our study occurred during only one year, so results may not refl ect
long-term patterns of prey densities or wintering scaup use of these estuaries.
Herring and Collazo (2004) also observed in their home-range analysis
that radio-tagged scaup rarely used the Mosquito Lagoon during the winter
of 2002. While these results combined do not provide any insight into longterm
effects, they do provide an understanding of why wintering scaup may
not have used the Mosquito Lagoon during our study period.
Recent research demonstrated that boat traffic by both commercial fishers
and recreational users was higher in the Mosquito Lagoon than in the
areas scaup used in the Indian River (Holloway-Adkins et al. 2006). However,
Holloway-Adkins et al. (2006) did not measure the response of increased
boat traffic on wintering scaup, so increased boat traffic cannot be linked
directly to lower wintering scaup use of the Mosquito Lagoon. We did not
measure the effects of human disturbance, but other studies have shown that
they can be detrimental to foraging scaup (see Havera et al. 1992, Knapton et
al. 2000, Korshgen et al. 1985). Future studies are needed to assess whether
human disturbance does play a role in the patterns of use within the IRL by
wintering scaup.
We found that scaup diets were similar to those reported for Louisiana
(Afton et al. 1991, Harmon 1962, Rogers and Korschgen 1966) and South
Carolina (Hoppe et al. 1986), in that principal food items were animal matter.
This finding contrasts with other studies in Louisiana (Chabreck and Takagi
1985), Michigan (Jones and Drobney 1986), and South Carolina (Perry
and Uhler 1982), where aquatic macrophytes were a primary food item for
wintering scaup. Differences in diet might be related to site characteristics
and associated biotic community. Anteau and Afton (2004) and Herring and
Collazo (2006) found that scaup did not increase nutrient reserve levels
prior to migration from the wintering grounds in Louisiana and Florida.
Consequently, wintering scaup may only need to meet maintenance levels
of reserves, likely obtainable from aquatic macrophytes, invertebrates, or a
combination of both.
Current habitat conditions (e.g., prey abundance) appear to meet the
wintering requirements— high survival (Herring and Collazo 2004), small
home ranges (Herring and Collazo 2005), and sufficient nutrient reserve
acquisition (Herring and Collazo 2006)— of scaup in the IRL. Maintaining
elevated densities and accessibility of invertebrates in areas with minimal
human disturbance may be important to continued use of this wintering site
by scaup and other avian species. Greater knowledge of the invertebrate
community in the Mosquito Lagoon may yield more definitive insights on
the relative low scaup use of this vast potential wintering site.
2009 G. Herring and J.A. Callazo 373
Acknowledgments
Funding was provided by the St. Johns River Water Management District and
US Fish and Wildlife Service Region IV. The North Carolina Cooperative Fish and
Wildlife Research Unit and North Carolina State University provided graduate support
and facilities. The North Carolina Cooperative Fish and Wildlife Research Unit
is jointly supported by the North Carolina Wildlife Resources Commission, North
Carolina State University, US Geological Survey, and Wildlife Management Institute.
We appreciate the support of M.B. Epstein (Senior Refuge Biologist) and the
MINWR staff. We thank our field research crew: Brenda Collado, Erin McDonald,
and Larissa Miller. Lastly, we thank Alan Afton, Nate Dorn, Heidi Herring, Keith
Hobson, Sam Lantz, and two anonymous reviewers for providing valuable comments
on previous drafts of this manuscript. This is contribution number 8 from the Wetlands
Initiative at Merritt Island, FL.
Literature Cited
Afton, A.D., and M.G. Anderson. 2001. Declining scaup populations: A retrospective
analysis of long-term population and harvest survey data. Journal of Wildlife
Management 65:781–796.
Afton, A.D., and C.D. Ankney. 1991. Nutrient-reserve dynamics of breeding lesser
scaup: A test of competing hypotheses. Condor 93:89–97.
Afton, A.D., R.H. Hier, and S.L. Paulus. 1991. Lesser Scaup diets during migration
and winter in the Mississippi fl yway. Canadian Journal of Zoology 69:328–333.
Alisauskas, R.T., R.T. Eberhardt, and C.D. Ankney. 1990. Nutrient reserves of
breeding Ring-necked Ducks (Aythya collaris). Canadian Journal of Zoology
68:2524–2530.
Ankney, C.D., and A.D. Afton. 1988. Bioenergetics of breeding Northern Shovelers:
diet, nutrient reserves, clutch size, and incubation. Condor 90:459–472.
Anteau, M.J., and A.D. Afton. 2004. Nutrient reserves of Lesser Scaup (Aythya
affinis) during spring migration in the Mississippi Flyway: A test of the spring
condition hypothesis. Auk 121:917-929.
Austin, J.E., C.M. Custer, and A.D. Afton. 1998. Lesser Scaup (Aythya affinis).
Number 338, In A. Poole and F. Gill (Eds.). The Birds of North America. The
American Ornithologist’s Union, Washington, DC, and Academy of Natural Sciences,
Philadelphia, PA.
Austin, J.E, A.D. Afton, M.G. Anderson, R.G. Clark, C.M. Custer, J.S. Lawrence,
J.B. Pollard, and J.K. Ringleman. 2000. Declining scaup populations: Issues,
hypotheses, and research needs. Wildlife Society Bulletin 28:254–263.
Bellrose, F.C. 1980. Ducks, Geese, and Swans of North America. Third Edition.
Stackpole Books, Harrisburg, PA.
Custer, C.M., and T.W. Custer. 1996. Food habits of diving ducks in the Great Lakes
after the Zebra Mussel invasion. Journal of Field Ornithology 67:86–99.
Harmon, B.G. 1962. Mollusks as food of Lesser Scaup along the Louisiana coast.
Transactions of the North American Wildlife and Natural Resources Conference
27:132–138.
Havera, S., L. Boens, M. Georgi, and R. Shealy. 1992. Human disturbance of waterfowl
on Keokuk Pool, Mississippi River. Wildlife Society Bulletin 20:290–298.
Herring, G., and J.A. Collazo. 2004. Winter survival of Lesser Scaup in east-central
Florida. Journal of Wildlife Management 68:1082–1087.
374 Southeastern Naturalist Vol. 8, No. 2
Herring, G., and J.A. Collazo. 2005. Habitat use, movements, and home range of
wintering Lesser Scaup in Florida. Waterbirds 28:71–78.
Herring, G., and J.A. Collazo. 2006. Lesser Scaup winter foraging and nutrient
reserve acquisition in east-central Florida. Journal of Wildlife Management
70:1682–1689.
Holloway-Adkins, K.G, D.M. Scheidt, E.A. Reyier, R.H. Lowers, and M.B. Epstein.
2006. Resource use characterization study of Mosquito Lagoon within the
boundaries of the Merritt Island National Wildlife Refuge. US Fish and Wildlife
Service Agreement No: 1448-40181-01-H-016. Dynamac Corporation, Kennedy
Space Center, FL.
Hoppe, R.T., L.M. Smith, and D.B. Wester. 1986. Foods of wintering diving ducks
in South Carolina. Journal of Field Ornithology 57:126–134.
Jones, J.J., and R.D. Drobney. 1986. Winter feeding ecology of scaup and Common
Goldeneye in Michigan. Journal of Wildlife Management 50:446-452.
JMP. 2001. A guide to statistics and data analysis using JMP and JMP IN software.
Second Edition. SAS Institute, Cary, NC.
Knapton, R.W., S.A. Petrie, and G. Herring. 2000. Human disturbance of diving
ducks on Long Point Bay, Lake Erie. Wildlife Society Bulletin 28:923–930.
Korschgen, C.E., L.S. George, and W.L. Green. 1985. Disturbance of diving ducks
by boaters on a migrational staging area. Wildlife Society Bulletin 13:290–296.
Perry, M.C., and F.M. Uhler. 1982. Food habits of diving ducks in the Carolinas.
Proceeddings of the Annual Conference of the Southeast Association of Fish and
Wildlife Agencies 36:492–504.
Prevett, J.P., I.F. Marshall, and V.G. Thomas. 1979. Fall food of Lesser Snow Geese
in the James Bay Region. Journal of Wildlife Management 43:736–742.
Provancha, J.A., and D.M. Sheidt. 2000. Long-term trends in seagrass beds in the
MosquitoLagoon and northern Banana River, Florida. P. 177–193, In M.J. Kennish
(Ed.). Seagrasses: Monitoring, Ecology, Physiology, and Management. CRC
Press, Boca Raton, FL.
Richman, E.S., and J.R. Lovvorn. 2004. Relative foraging value to Lesser Scaup
ducks of native and exotic clams from San Francisco Bay. Ecological Applications
14:1217–1231.
Rogers, J.P., and L.J. Korschgen. 1966. Foods of Lesser Scaup on breeding, migration,
and wintering areas. Journal of Wildlife Management 30:258–264.
Swanson, G.E., and J.C. Bartonek. 1970. Bias associated with food analysis in gizzards
of Blue-winged Teal. Journal of Wildlife Management 34:739–746.
Swanson, G.E., G.L. Kapu, J.C. Bartonek, J.R. Serie, and D.G. Johnson. 1974.
Advantages in mathematically weighing waterfowl food habits data. Journal of
Wildlife Management 38:302–307.
US Fish and Wildlife Service. 2008. Waterfowl population status, 2008. US Department
of the Interior, Washington, DC.
Virnstein, R.W., and P.A. Carbonara. 1985. Seasonal abundance and distribution
of drift algae and seagrasses in the mid-Indian River Lagoon, Florida. Aquatic
Botany 23:67–82.


 The Southeastern Naturalist is a peer-reviewed journal that covers all aspects of natural history within the southeastern United States. We welcome research articles, summary review papers, and observational notes.