Southeastern Naturalist
K. Stephens, J. Sencindiver, and J. Skousen
2015 Vol. 14, Special Issue 7
40
Canaan Valley & Environs
2015 Southeastern Naturalist 14(Special Issue 7):40–57
Characteristics of Wetland Soils Impacted by Acid Mine
Drainage
Kyle Stephens1, John Sencindiver1, and Jeff Skousen1,*
Abstract - A proposed section of Appalachian Corridor H, an interstate highway that
begins at I-79 near Weston, WV, and will continue east to I-81 at Strasburg, VA, will
pass through an area of the Beaver Creek watershed that was previously mined for the
acid-producing Upper Freeport coal. Beaver Creek flows into the Blackwater River after
flowing out of Canaan Valley. Partially reclaimed spoils from past mining activities are
generating acid mine drainage. Wetlands adjacent to the spoils support plant communities
that appear to be naturally treating the drainage. To better understand the chemical and
physical functions within the wetlands and to assist the West Virginia Division of Highways
in constructing wetlands for mitigating environmental damage, we described the
soils of the mine-drainage-impacted wetlands (Narrow Wetland, Iron Pond, and Railroad
Grade) and took samples for subsequent laboratory analyses. For comparison, we also described
and sampled unimpacted soils in Elder Swamp, which is an adjacent wetland that
receives no mine drainage. The impacted wetland soils had thinner organic and mineral
horizons and were lower in C and N than unimpacted soils. The electrical conductivity
was low for all wetland soils, and pH ranged from 3.2–6.1, with both low and high pH
values in impacted and unimpacted soils. These results were reflected in the overall lower
quality of vegetation that we noticed in the impacted wetlands.
Introduction
Section 404 of the 1977 Clean Water Act defines jurisdictional wetlands as
“those areas that are inundated or saturated by surface or ground water at a frequency
and duration sufficient to support, and that under normal circumstances
do support, a prevalence of vegetation typically adapted for life in saturated soil
conditions” (Environmental Laboratory 1987). Wetlands perform unique ecological
functions: they filter water, recharge aquifers, mitigate flood events, and
may support rare and diverse flora and fauna (Mitsch and Gosselink 2000). For
an area to be identified as a jurisdictional wetland, three key features must be
present: 1) hydric soils, 2) hydrophytic vegetation, and 3) wetland hydrology.
Hydric soils form through unique pedogenic processes such as horizon development,
carbon (C) accumulation and distribution, low redox conditions, and
water saturation. These processes allow for the development of easily identifiable
morphological features that are distinctly different from the features of nonhydric
soils. A hydric soil, by definition, is “a soil which is saturated, flooded, or
ponded long enough during the growing season to develop anaerobic conditions
in the upper part” (USDA-NRCS 1995). Anaerobic conditions develop when water
fills the soil pores, which decreases the rate at which oxygen (O2) can diffuse
1West Virginia University, Division of Plant and Soil Sciences, PO Box 6108, Morgantown,
WV 26506. *Corresponding author - jskousen@wvu.edu.
Southeastern Naturalist
K. Stephens, J. Sencindiver, and J. Skousen
2015 Vol. 14, Special Issue 7
41
through the soil (Mitsch and Gosselink 2000). In submerged soils, the rate of O2
diffusion through the water-filled pores is four to five orders of magnitude slower
than the rate of O2 diffusion in a well-drained soil (Howeler and Bouldin 1971).
Under these conditions, the remaining dissolved O2 in the subsurface is rapidly
consumed through microbial respiration, and the redox potential (Eh) decreases
as alternative electron acceptors such as iron oxides are used during anaerobic
incubation (Faulkner and Patrick 1992, Gambrell and Patrick 1978, Ponnamperuma,
1972). When all of the O2 is removed from the system, the soil is considered
reduced. After the O2 is removed, manganese (Mn), iron (Fe) and other
elements may undergo reduction, allowing for the development of gray colors,
or gleying, in the subsurface horizons (Environmental Laboratory 1987). If the
soil is periodically saturated, mottles (rust- or gray-blue-colored spots, depletions
and or concentrations, respectively) may develop. These features are indicators
of alternating periods of oxidation and reduction (Faulkner and Patrick 1992),
during which Fe and Mn are mobilized by reduction and then immobilized in the
form of oxides during the subsequent drying cycle by oxidation (Pickering and
Veneman 1984).
The presence of reduced conditions may be determined by measuring soil
Eh with platinum-tipped redox electrodes. The critical Eh value indicating that
the soil has been reduced is related to soil pH. Thus, critical Eh varies among
soils with different pHs. For analysis, this variability is nullified by adjusting Eh
values to a pH of 7. A soil meets the anaerobic conditions of the recommended
hydric soil technical standards if Eh measures ≤175 mV at pH 7 (National Technical
Committee for Hydric Soils 2004).
In submerged hydric soils, decomposition rates are drastically reduced compared
to aerobic non-hydric soils, thus allowing for the accumulation of organic
matter. McLatchey and Reddy (1998) reported that about three times more C is
decomposed in aerobic soils compared to anaerobic soils. The reduced decomposition
rates are a result of anaerobic respiration, which is slowed by microbial use
of electron acceptors other than O2 (Furhmann 1998). In incompletely submerged
hydric soils, decomposition rates are reduced, but the rate will be a function of
the hydrologic regime.
Soil horizons are considered organic if they contain 12–20% organic C, with
the variation related to percent clay (Soil Survey Staff 1993). Three types of organic
horizons are identified in soils: 1) Fibric (Oi) = least decomposed organic
materials, 2) Hemic (Oe) = partially decomposed organic materials, and 3) Sapric
(Oa) = most decomposed organic materials. If >40 cm of organic material
accumulates in a soil, the soil is considered to be an organic soil, also known
as a Histosol. If <40 cm of organic material accumulates, the soil is considered
a mineral soil. Mineral soil horizons are designated as either A, B or C. A horizons
show signs of soil development and usually contain more carbon and roots
than B and C horizons. Like A horizons, B horizons exhibit some degree of development.
C horizons are undeveloped, lack structure, and are found beneath A
and B horizons.
Southeastern Naturalist
K. Stephens, J. Sencindiver, and J. Skousen
2015 Vol. 14, Special Issue 7
42
Northern peatlands are dominated by Histosols that have an accumulation
of peat over mineral materials. The wetland soils of Canaan Valley (hereafter,
the Valley), WV, and the adjacent Beaver Creek watershed situated north of the
Valley, are similar to northern peatland soils. Peatlands are characterized by a
perched water table, low pH, high cation exchange capacity soils, and an accumulation
of peat. Depending on a site’s vegetation and hydrology, bogs, marshes,
fens, and swamps can develop in peatlands. Fens and marshes prevail in the
Valley and the Beaver Creek watersheds. Histosols and mineral hydric soils are
common in these areas. Wetland soils in both areas have developed in similar
parent materials, on similar topographic positions, under similar climates, and in
the same amount of time, resulting in similar soil types. The differences between
the Valley’s wetland soils and those in the Beaver Creek watershed are the presence
of multiple, partially reclaimed Upper Freeport and Bakerstown mine spoils
and active mining operations in the Beaver Creek watershed. Acid mine drainage
(AMD) and sediments from past mining activities flow into many wetlands of the
Beaver Creek watershed, resulting in wetland degradation.
AMD is acidic, sulfate-rich runoff that forms upon exposure of pyrite (FeS2)
or other sulfidic materials to O2 and water. Though the chemistry is variable,
AMD typically has high metal concentrations, with Fe and Mn in the range of
20–2000 and 4–126 mg L-1, respectively, and pH of 2–4.5 (Appalachian Regional
Commission 1969). Furthermore, elevated aluminum (Al) and sulfate (SO4
2-)
concentrations are often associated with AMD (Skousen et al. 2000). In the Appalachian
coal mining region, FeS2, which is commonly found in Upper Freeport
coal seams, is the primary mineral that forms AMD. When exposed to O2 and
water, FeS2 is oxidized, and Fe+2, acidity (H+), and SO4
2- are generated (Geidel
and Caruccio 2000).
The West Virginia Division of Highways (WVDOH) Corridor H project,
in Tucker County’s Beaver Creek watershed, will affect wetland habitats. The
WVDOH intends to minimize any potential impacts during disturbance of these
habitats. The objectives of this study were to assist WVDOH in evaluating
wetlands along the proposed route of Corridor H, and to establish the baseline
status of the Beaver Creek watershed’s wetlands. We also compared physical
and chemical properties of wetlands impacted by AMD to unimpacted wetlands.
The study was part of a larger ongoing study to evaluate the impacts of AMD on
sulfate reduction and other soil properties.
Methods
Site descriptions and sampling locations
In the summer of 2001, nine transects were established in four Beaver Creek
watershed wetlands (Fig. 1). We described soils and sampling locations every 50
or 100 m along the transect, depending on the wetland size. In total, 31 description
and sampling locations were included in the study, and each soil was described
according to standard soil survey procedures (Soil Survey Division Staff
1993). A Dutch auger and peat sampler were used to expose soils for descriptions
Southeastern Naturalist
K. Stephens, J. Sencindiver, and J. Skousen
2015 Vol. 14, Special Issue 7
43
and to remove soil samples. If we observed soil uniformity along a transect, we
did not take samples from all description sites. We sampled 25 of the 31 described
soils for laboratory analyses. Sampling was based on soil profile descriptions,
with organic horizons sampled by type (i.e., Oi sampled together, Oe sampled
together, Oa sampled together). We sampled subsurface mineral horizons at the
following depths: M1 = 0–10 cm, M2 = 10–30 cm, M3 = 30–60 cm, and M4 =
60–100 cm, with M1 the uppermost layer and M4 the deepest. Based upon profile
descriptions, the average total thickness of the organic layer and the solum were
calculated. The solum is the portion of the soil that has undergone some development
and includes all O, A, and B horizons.
The four wetlands sampled in this study are identified as Narrow Wetland,
Iron Pond, Railroad Grade, and Elder Swamp (Fig. 1). Narrow Wetland is a relatively
flat wetland located adjacent and southeast of Rt. 93. We described soils at
six sampling locations in this wetland and took samples from three of them. The
water table in Narrow Wetland is at or near the surface through much of the year,
creating anaerobic conditions. Drainage appeared to be impeded by the presence
of Rt. 93, which crosses at the wetland terminus. The soils were impacted by adjacent,
partially-reclaimed Upper Freeport coal spoils, located on the wetland’s
western side. Tyha latifolia L. (Common Cattail), Carex spp. (sedges), Spahgnum
spp. (sphagnum mosses), and Polytrichum spp. (hair-cap mosses) were the prevalent
species throughout this wetland.
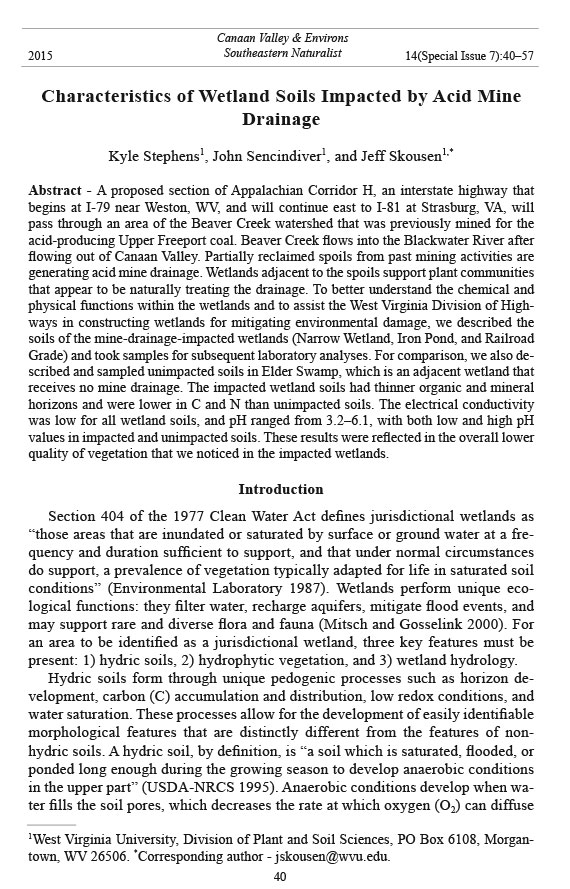
Figure. 1. Aerial photograph of wetland sites in Beaver Creek watershed, Tucker County,
WV. Wetlands are green shaded areas with names as designated for our study.
Southeastern Naturalist
K. Stephens, J. Sencindiver, and J. Skousen
2015 Vol. 14, Special Issue 7
44
Railroad Grade, located on the northwestern side of Rt. 93, was less impacted
than Narrow Wetland or Iron Pond. Two transects were established in
this wetland, and soils were described and sampled at seven locations: three on
one transect and four on the other. Sediments and AMD from the Upper Freeport
coal spoils located on the western end of Railroad Grade directly across Rt.
93 appeared to have impacted two of the seven soil sampling locations. The remaining
five soils did not appear to be impacted. An abandoned railroad grade
on the northeastern side of this wetland impeded drainage, thus creating wetter
conditions than would normally prevail in the wetland. Mosses dominated
Railroad Grade vegetation, and sparse populations of sedges and cattails were
scattered throughout.
Iron Pond is the youngest, smallest, and by far the most impacted wetland in
the study. Steep, partially reclaimed Upper Freeport coal spoils surround this
wetland, and sediments from the spoils have eroded into the wetland and are
components of the wetland substrate. This wetland is anthropogenic in nature
and received AMD from multiple seeps along the base of the surrounding spoils
(Fig. 1). A small stream bisects the Iron Pond wetland before it spills into an
orange-colored pond that is impounded by Rt. 93 and surrounding mine soils.
Route 93 hinders drainage where it crosses at Iron Pond’s terminus. The combination
of Rt. 93 and the presence of mine spoils were the main factors affecting
soil development in this wetland. Soils were described and sampled at five locations
along one transect spanning the length of Iron Pond (Fig. 2). Sampling
locations represented the diverse assemblage of cattails, mosses, and sedges
which dominated this wetland’s flora.
Elder Swamp, the largest wetland in the study area, is classified as an Exceptional
Resource Value and as a Wetland Special Area by West Virginia University
(1995). These classifications designate wetlands with unique qualities and properties.
Elder Swamp is situated on the northwestern side of Rt. 93 and east of
Iron Pond. Five transects were established in the following habitats: one each
in alder thicket, forested wetland, and scrub-shrub wetland habitats; and two in
fen-marsh wetland areas. Soils were described at three locations and sampled at
two locations in the alder thicket, an area dominated by Alnus incana ssp. rugosa
L. (Speckled Alder). We described and sampled soils at two locations in the forested
wetland, which was located in a thin stand of Pinus strobus L. (White Pine)
slightly upslope from the alder thicket and the fen-marsh wetland. Soils were also
described and sampled at two locations in the scrub-shrub wetland, which was
located adjacent to the forested wetland and dominated by mosses, Vaccinium
spp. (blueberries), and Hypericum spp. (St. John’s wort). Soils in the forested and
scrub-shrub wetlands were similar, so we grouped them together and will refer
to them as the soils of the transitional wetlands. Fen-marsh wetland vegetation
was dominant in Elder Swamp, where sphagnum and hair-cap mosses covered the
ground and a few sedges were present. The fen borders the marsh, which makes
up the central portion of Elder Swamp. The marsh was dominated by cattails
growing on peat hummocks. A braided stream that feeds nearby beaver ponds
Southeastern Naturalist
K. Stephens, J. Sencindiver, and J. Skousen
2015 Vol. 14, Special Issue 7
45
flows through the marsh area. Soils were described at six locations and sampled
at four locations on the two Elder Swamp transects.
Laboratory analyses
All soil samples were air-dried and passed through a 2-mm sieve for analyses.
Soil samples were analyzed for total C, total N, and total S on a LECO CNS 2000
analyzer. Soil pH was measured in a 1:1 soil water suspension using a silver/
silver chloride double junction electrode. Many of the soil samples with high
C values required water additions to the pH water:soil suspensions. All mineral
soils were analyzed for relative particle size using the pipette method (Soil Survey
Staff 1996). Other analyses, completed as part of a larger study, are reported
elsewhere (Stephens 2003).
Redox potential
In the fall of 2001, platinum-tipped redox electrodes were constructed according
to Faulkner et al. (1989). In December 2001, electrodes were placed
in the ground and the first measurements were taken 24 hours after initial
placement. Redox measurements were made in the field for 15 months using a
portable voltmeter and a saturated calomel reference electrode. Measurements
were not taken in February 2003 due to a severe snowstorm which restricted access
to the study sites.
Meter readings were adjusted by adding 200 mV, so redox potential was
based on the standard hydrogen reference electrode, not the saturated calomel
electrode. At each redox sampling location, six probes were permanently placed
in the soil at a depth of 20 cm and six probes were placed at a depth of 10 cm.
Measurements from the six electrodes were averaged and reported as a single
redox value. Measurements were taken at three locations in each of the following
wetlands: Railroad Grade, Iron Pond, and Elder Swamp. In Railroad Grade,
one location was AMD-impacted and the other two locations were not impacted.
At Iron Pond, measurements were taken from three locations representing three
different vegetative communities. All sites in Iron Pond were AMD-impacted. In
Elder Swamp, measurements were taken from soils in the fen, marsh and scrubshrub
areas. None of these areas was considered to be AMD-impacted.
Redox probes at the 10-cm depth were placed in the soil’s A horizon in the
scrub-shrub site and in organic horizons at all other sites. At the 20-cm depth,
the probes were placed in a B horizon at the scrub-shrub site and in A horizons at
Iron Pond stop 5 and Railroad Grade stop 1 (Fig. 2). At all other sites, the 20-cm
probes were placed in organic horizons.
Soil pH was also measured in the field at 10-cm and 20-cm depths when each
of the monthly redox potential readings was taken. To simplify interpretation of
Eh readings and comparisons among wetlands, redox potentials were adjusted
to represent Eh at pH 7. This adjustment was made by subtracting 59 mV for
each pH unit of decrease below pH 7 (Karathanasis et al. 2003), using field
pH measurements, which were taken at the same time as the redox potential
Southeastern Naturalist
K. Stephens, J. Sencindiver, and J. Skousen
2015 Vol. 14, Special Issue 7
46
measurements. In addition to these field readings, we made measurements in the
laboratory using the air-dried and sieved samples.
Figure. 2. Map of Iron Pond wetland in the Beaver Creek Watershed. Transect, sampling
locations (stops), stream, and AMD seeps are identified.
Southeastern Naturalist
K. Stephens, J. Sencindiver, and J. Skousen
2015 Vol. 14, Special Issue 7
47
Only results for the measurements at 20 cm from the marsh and scrub-shrub areas
of Elder Swamp and an unimpacted area of Railroad Grade are presented here.
The values for these wetlands represent the range of redox potential found in all
wetlands of this study. Additional redox data may be found in Stephens (2003).
Results and Discussion
Narrow Wetland
The total mean thickness of organic horizons in the Narrow Wetland was 16
cm with a range of 3–42 cm (Table 1). The mean value for Oi horizons was 13
cm with a range of 3–42 cm (Table 1). Oe horizons were described at only three
locations, and the mean thickness was 10 cm with a range of 6–17 cm (Table 1).
Based on these data, no soil described in this wetland would be classified as a
Histosol. No Oa horizons were described in Narrow Wetland, but A horizons
were described in every soil. Lack of Oa horizons indicates that the organic material
was relatively young and not well decomposed. This wetland most likely
became saturated following the construction of Rt. 93 in 1977. This recent formation
would explain the presence of thick Oi and Oe surface horizons, but no Oa
horizons. Furthermore, the presence of well-developed A horizons is an indicator
of soils that have developed under non-saturated conditions.
Total C for the organic material had a mean value of 24.1% with a range of
16.2–29% (Table 2). Mean C values sharply decreased from the organic layer to
the mineral layer, but the C values were relatively high for a mineral soil, ranging
from 6.3–6.7%. Total S was highest in the organic layer at 0.9% with a range
of 0.3–1.6%. The highest S value (1.6%) was observed in a soil located near an
AMD seep. This value is similar to those reported for high S tidal marsh soils
(Rabenhorst and Hearing 1989), indicating that this soil received more S than
normal fresh water wetlands. Sulfate introduced by inflowing AMD was most
likely the source of this additional S. Values for N (0.4%) and pH (5.6) were
highest in the organic layer, and decreased in the mineral layers (Table 2). The
average texture in the M1 layer was silty clay loam, and the texture of the M2 and
M3 layers was silt loam (Table 3).
Iron Pond
In Iron Pond, five locations were established along one transect, with stop 1
located at the head of Iron Pond and stop 5 located closest to Rt. 93 (Fig. 1). Of
the five locations, all except stop 1 received some AMD. Soils at each location
had an Oi horizon consisting mainly of moss fibers. The mean thickness of the Oi
horizons (19 cm) was the highest for any wetland in this study (Table 1). No Oa
horizons were described at any location, and only two soils contained Oe horizons
(Table 1). As with the Narrow Wetland, Iron Pond had no well-decomposed
Oa horizons. Since Oi horizons were dominant, the mean total thickness of the
organic horizon was similar to the mean thickness of the Oi horizon (Table 1).
The solum thickness of 31 cm was the thinnest of any wetland (Table 1), indicating
that the soil was the youngest in the study.
Southeastern Naturalist
K. Stephens, J. Sencindiver, and J. Skousen
2015 Vol. 14, Special Issue 7
48
Table 1. Thickness of individual organic horizons (Oi, Oe, and Oa), total thickness of all organic horizons, A horizon thickness, and solum thickness. Values
expressed as a mean (in cm) of all soils sampled in each wetland, with n representing the number of soils in each the wetland that contained the horizon
type. Solum thickness defined as sum of all organic, A and B horizons.
Organic layer
Oi Oe Oa thickness A Solum
Wetland ID n Mean Range n Mean Range n Mean Range n Mean Range n Mean Range n Mean Range
Narrow Wetland 5 13 3–42 3 10 6–17 0 - - 6 16 3–42 6 9 2–15 6 39 10–69
Iron Pond 5 19 18–23 2 12 11–13 0 - - 5 29 20–50 1 6 6 5 31 20–50
Railroad Grade 7 16 7–33 7 8 4–12 4 16 12–24 7 33 17–54 4 8 6–19 7 52 25–66
Elder Swamp:
alder thicket 1 3 3 3 6 3–7 3 16 6–31 3 22 13–34 1 6 6 3 101 94–108
transitional soils 0 - - 2 6 4–7 3 6 4–9 4 7 4–11 4 4 2–5 4 106 90–123
fen marsh 5 12 4–23 6 20 7–38 6 55 12–99 6 94 48–120 0 - - 7 102 90–120
Southeastern Naturalist
K. Stephens, J. Sencindiver, and J. Skousen
2015 Vol. 14, Special Issue 7
49
The average texture for the mineral layers was loam or silt loam, but the
ranges indicate extreme differences in texture among individual soils (Table 3).
The sand content of the mineral layers decreased along the transect from the head
of Iron Pond to the terminus of the transect. As a result, the proportion of soil
clay and silt increased along the transect. The decrease in sand across the wetland
probably related to deposition of sands from sediments entering at the head of the
wetland via the stream.
Table 2. pH and total carbon, sulfer, and nitrogen, for wetland soils of the Beaver Creek watershed.
n = the number of soil samples taken from each wetland, Horizon = soil layer from which samples
were taken. Values are expressed as mean for each wetland followed by range. BDL = below detectable
limit.
Wetland ID/ pH % carbon % sulfur % nitrogen
Horizon n Mean Range Mean Range Mean Range Mean Range
Narrow Wetland
O 3 5.6 5.4–5.9 24.1 16.2–29.0 0.9 0.3–1.6 0.4 0.4–0.5
M1 3 4.9 4.5–5.6 6.7 5.1–9.0 0.6 0.1–1.2 0.1 0.1–0.1
M2 3 5.1 4.5–5.7 6.3 5.1–8.0 0.3 0.1–0.3 0.1 BDL–0.2
M3 3 5.2 4.6–6.1 6.5 5.5–8.2 0.2 0.1–0.3 0.1 0.1–0.2
Iron Pond
O 5 4.2 3.2–6.0 15.4 9.6–21.4 0.8 0.2–1.6 0.2 0.2–0.3
M1 5 4.9 4.5–5.7 4.0 2.5–8.7 0.3 0.1–0.7 0.1 BDL–0.1
M2 5 4.5 4.0–4.8 1.3 0.8–1.5 0.1 0.1–0.2 BDL BDL
M3 5 4.5 4.4–4.9 2.2 1.4–4.3 0.1 BDL–0.1 BDL BDL
M4 2 4.9 4.4–4.8 2.8 1.4–4.3 0.1 0.1 BDL BDL
Railroad Grade
O 7 4.5 4.0–5.2 28.8 18.7–35.0 0.8 0.5–1.6 0.4 0.1–0.8
M1 7 4.2 3.9–4.7 6.9 4.3–11.2 0.2 0.1–0.7 0.1 BDL–0.2
M2 7 4.3 3.9–4.9 9.6 1.6–25.4 0.5 0.1–2.1 0.3 0.1–0.3
M3 4 4.3 4.3–4.4 6.8 1.2–7.0 0.3 0.1–0.5 0.1 BDL–0.1
Elder Swamp: alder thicket
O 2 5.4 5.0–5.8 31.9 29.0–34.8 0.6 0.5–5.0 1.2 1.0–1.4
M1 2 4.8 4.7–4.8 9.3 9.2–9.5 0.1 0.1 0.1 0.1
M2 2 4.7 4.7–5.0 9.2 8.1–10.4 0.2 0.1–0.2 0.1 0.1–0.2
M3 2 4.8 4.6–5.0 7.9 4.6–11.3 0.3 0.2–0.4 0.2 0.1–0.3
Elder Swamp: transitional soils
O 4 4.0 3.8–4.3 30.5 23.2–33.8 0.2 0.2–0.4 1.1 0.9–1.5
M1 4 3.7 3.6–3.8 6.4 2.4–8.2 0.1 0.1 0.2 0.1-–0.2
M2 4 3.9 3.9–4.0 2.5 1.6–3.6 BDL BDL BDL BDL–0.1
M3 4 4.2 4.1–4.3 2.0 0.7–4.6 BDL BDL BDL BDL
M4 4 4.6 4.4–4.8 2.0 0.7–3.9 BDL BDL–0.1 BDL BDL
Elder Swamp: fen marsh
O 4 4.6 3.8–5.7 36.5 25.2–47.0 0.7 0.5–1.1 1.1 0.9–1.3
M1 2 4.3 3.9–4.7 4.9 2.0–7.8 0.1 BDL–0.1 0.1 BDL–0.1
M2 1 4.8 4.8 4.8 4.8 0.1 0.1 BDL BDL
M3 1 4.8 4.8 4.9 4.9 0.1 0.1 0.1 0.1
Southeastern Naturalist
K. Stephens, J. Sencindiver, and J. Skousen
2015 Vol. 14, Special Issue 7
50
The mean pH of the organic layer was 4.2, the lowest in the study, but values
ranged from 3.2–6.0 (Table 1). From stop 1 to stop 5, the pH of the Oi horizons
sharply decreased as follows: 6.0 > 5.0 > 3.4 > 3.6 > 3.2 (Fig. 1). The lower pH
reflected the addition of AMD along the length of the wetland from stop 1 to stop
5. The pH of the mineral material was similar to that of the mineral material in
the other wetlands.
Iron Pond’s organic layer had the lowest total C (15.4%) of any wetland
(Table 2). Mean C content of the mineral layers was very low with a range of
1.3% in the M2 layer to 4.0% in the M1 layer (Table 2). Sulfur concentrations
were highest in the O layer, which had an average of 0.8% and a range of 0.2–
1.6% (Table 2). The high S values in conjunction with low C values indicated that
the wetland retained some S from sulfate imported by AMD. Organic and mineral
layer N values were the lowest of any soil in the study (Table 2).
Railroad Grade
The mean thickness of the organic layer (33 cm) was second only to Elder
Swamp’s fen-marsh wetland (Table 1). The organic layer thickness ranged from
17–54 cm (Table 1), with the lower values observed in the two impacted soils.
Table 3. Particle size of all mineral layers in each wetland of the Beaver Creek watershed. Values
expressed as mean, with n representing the number of mineral layers used to obtain the value. SiL
= silt loam, SiCL = silty clay loam, L = loam, LS = loamy sand.
% sand % silt % clay Texture
Wetland ID Horizon n Mean Range Mean Range Mean Range class
Narrow Wetland M1 3 6.8 1.5–7.2 54.6 51.0–58.3 38.6 29.6–47.5 SiCL
M2 3 18.7 7.2–31.0 55.3 46.9–58.9 26.0 22.1–28.1 SiL
M3 3 29.1 19.5–31.0 50.8 42.41–58.9 20.5 17.8–21.6 SiL
Iron Pond M1 5 31.9 4.1–66.3 46.6 20.3–66.4 24.1 12.85–36.9 L
M2 5 36.3 6.1–66.0 50.5 20.3–49.4 22.5 14.9–32.1 SiL
M3 5 22.9 22.2–23.6 51.0 46.5–55.5 26.1 20.8–31.3 SiL
Railroad Grade M1 7 8.7 0.5–13.7 61.6 53.8–86.1 29.2 7.6–41.8 SiL
M2 7 8.7 1.4–18.6 56.7 46.4–64.7 29.7 32.8–38.7 SiCL
M3 4 23.8 2.6–61.6 49.3 25.6–59.2 27.0 12.8–41.5 SiCL
Elder Swamp: M1 2 2.7 1.8–3.6 61.6 29.3–63.9 35.8 32.6–38.9 SiCL
alder thicket M2 2 3.6 3.4–3.7 60.5 59.6–61.4 36.0 35.2–36.7 SiCL
M3 2 23.9 14.0–33.8 52.6 45.6–59.6 23.5 20.6–26.4 SiL
Elder Swamp: M1 4 17.1 3.7–37.6 59.4 45.3–65.6 23.5 17.1–35.1 SiL
transitional soils M2 4 25.0 15.3–40.8 48.7 36.0–59.6 26.2 22.8–28.5 SiL
M3 4 37.8 33.4–47.1 40.6 32.9–47.3 23.9 20.0–28.0 SiL
M4 4 38.4 30.0–53.6 43.0 31.6–47 20.8 14.8–32.4 SiL
Elder Swamp: M1 2 18.2 9.3–27.1 53.2 47.1–59.3 28.7 13.7–43.6 SiL
fenmarsh M2 1 78.5 78.5 16.9 16.9 4.6 4.6 LS
M3 1 50.7 50.7 39.7 39.7 9.7 9.7 L
Southeastern Naturalist
K. Stephens, J. Sencindiver, and J. Skousen
2015 Vol. 14, Special Issue 7
51
The impacted soils were subjected to an input of sediments and AMD from nearby
mine spoils, two factors that probably inhibited organic horizon development.
Soils were described and sampled at seven locations in Railroad Grade and all
had Oi and Oe horizons (Table 1). Four of the seven soils had Oa horizons and
the mean thickness of the Oa was 16 cm, second highest in the study (Table 1).
The 52-cm solum thickness at Railroad Grade was greater than the thicknesses at
Narrow Wetland and Iron Pond, but only about half the solum thickness at Elder
Swamp (Table 1). An abandoned railroad grade, situated along the entire length
of the northeastern border of the Railroad Grade wetland, has slowed drainage
and changed the wetland hydrology, similar to the effects of Rt. 93 on Narrow
Wetland and Iron Pond.
Mean values for pH of both the organic layer and mineral layers ranged from
4.2–4.5 (Table 2). Average C concentration in the organic layer was 28.8% with
a range of 18.7–35.0%, which was similar to those in the Alder Thicket and Narrow
Wetland (Table 2). Average C content in the mineral layers was similar to
the values for Narrow Wetland. S content (0.8%) and range (0.5–1.6%) for the
organic layer were almost identical to values for Narrow Wetland and Iron Pond
(Table 2). As observed at Iron Pond and Narrow Wetland, the higher S concentrations
were observed in impacted organic layers, indicating that S is being retained
in the AMD-impacted soils. Nitrogen values also were similar to those observed
in Iron Pond and Narrow Wetland. The organic layer had a mean total N value
of only 0.4%, and the mineral layers had either 0.1% or 0.3% total N (Table 2).
Texture of the mineral soils was consistent throughout the wetland, with silty clay
loam or silt loam textures observed in all soils.
Alder thicket
Oa and Oe horizons were described at every location in the Elder Swamp alder
thicket habitat. The mean thickness was 16 cm for the Oa and 6 cm for the Oe
horizon (Table 1). An Oi horizon was described at only one location. These data
indicate that organic material in this wetland decomposed at a higher rate than
the decomposition rates that we observed at some of the other wetlands, resulting
in the formation of 16-cm-thick, well-decomposed Oa horizons. The presence of
only one Oi horizon and thin (6 cm) Oe horizons supported these findings. When
soils in this wetland were sampled and described, the water table was 20 cm
below the surface. Therefore, this wetland was not saturated at the surface year
round. The mean solum thickness was 101 cm, which means that soil in this wetland
was more pedologically developed than soils in Iron Pond, Narrow Wetland,
and Railroad Grade.
The mean thickness of the organic layer was only 22 cm with a range of 13–34
cm (Table 1). Yet in the mineral layers, C contents were almost 10%, indicating
this wetland accumulated and incorporated C in the mineral soil. The mean C
content of the organic layer was 31.9% with a range of 29.0–34.8% (Table 2).
These values were similar to the 26.2% total C that Chambers (1996) reported for
a wetland dominated by alder in the Valley. Mean total N values of the organic
Southeastern Naturalist
K. Stephens, J. Sencindiver, and J. Skousen
2015 Vol. 14, Special Issue 7
52
layer were 1.2% with a range of 1.0–1.4%. These were the highest N values observed
in the organic layer of any wetland in the study and they were similar to
the 1.3% reported by Chambers (1996) for a wetland dominated by alder in the
Valley. At 0.6%, mean S values were lower than those observed in Iron Pond,
Narrow Wetland, and Railroad Grade. The alder thicket area is not impacted by
AMD, therefore high S values were not expected. The S content of the mineral
layers was similar to the mineral layers of other wetlands.
The mineral material consisted of silty clay loam textures in the M1 and M2
layers which overlay a silt loam texture in the M3 layer (Table 3). The sand
content was never greater than 3.7% in the M1 and M2 layers, but sharply increased
to as high as 33.9% in the M3 layer (Table 3). This finding indicated
that sediments in the mineral layers (M1, M2, M3) were deposited under different
conditions.
Transitional wetlands (forested and scrub-shrub wetlands)
Forested and scrub-shrub wetlands were saturated at the surface for only short
periods of time in most years, as indicated by a thin (7 cm), well-decomposed
organic layer (Table 1). All organic horizons in these soils were either Oa or Oe.
As we observed in the alder thicket wetland, lack of Oi horizons indicated that
organic materials decomposed faster than the organic materials in other wetlands.
Soils in these wetlands were the driest in the study. The solum thickness (106 cm)
was the greatest in the study, which means that the soils in transitional wetlands
were well developed (Table 1). The solum mostly consisted of deep Bt and Bx
horizons in the subsurface. The Bt is a horizon of clay accumulation, and the
Bx is a fragipan, which is a loamy layer that is dense, brittle, and restricts root
and water movement. The fragipan was responsible for perching the water table,
which in turn has allowed hydric soil conditions to develop.
The mean C content of the organic layer was 30.5% with a range of 23.2–33.8%
(Table 2). This value was similar to those observed in Narrow Wetland, Railroad
Grade, and the alder thicket portion of Elder Swamp. Unlike those wetlands, the
transitional wetlands had much thinner organic layers and were much drier. In the
M1 layer, the carbon content was 6.4%, with a range of 2.4–8.2% (Table 2). This
layer was primarily made up of A horizons, which are mineral horizons that usually
contain the most carbon. In the M2, M3, and M4 layers, the C content dropped to
around 2.0% (Table 2). Total N for the organic layer was 1.1% with a range of 0.9–
1.5% (Table 2). N in the mineral layers ranged from below detection limits (BDL)
to 0.2% (Table 2). For both the organic and mineral layers, S content was the lowest
in the study. Only 0.2% S was observed in the organic layer, and observed mineral
layer S was BDL–0.1% (Table 2). All pH values in these soils were near 4.0
(Table 2). Alder thicket soils are characterized by low base saturation. The mineral
material consisted of silty clay loam and loam textures (Table 3).
Fen-marsh
Soils in the Elder Swamp fen-marsh wetland were deep, saturated, and high
in organic C. The mean thickness of the organic layer was 94 cm with a range of
Southeastern Naturalist
K. Stephens, J. Sencindiver, and J. Skousen
2015 Vol. 14, Special Issue 7
53
48–120 cm (Table 1). In most of the described soils, no mineral material was observed
to a depth of 120 cm, the maximum depth of sampling. However, mineral
material was described at two locations. In one, it was a silty clay loam C horizon
and at the other location it consisted of both B and C horizons. The silty clay loam
material may be perched and holding the water table in this wetland.
The organic layer consisted of Oi, Oe, and Oa horizons. The mean thickness of
the Oa horizons was 55 cm, by far the thickest in any wetland (Table 1). Organic
C content of the organic layer was 36.5% with a range of 25.2–47.0% (Table 2).
This was the highest value observed in the study and is similar to values observed
by Chambers (1996) in a moss-lichen wetland in the Valley. Average S concentration
in the organic layer was 0.7% with a range of 0.5–1.1% (Table 2), similar
to values observed in all other wetlands except the transitional wetlands. Total N
in the organic layer was 1.1% with a range of 0.9–1.3% (Table 2). The lowest
N values were observed at the two locations sampled in the fen.
The average pH of the organic layers was 4.6, but ranged from 3.8–5.7
(Table 2). The range reflected differences in pH between soils in the marsh and
the fen areas of the Elder Wetland. The fen is a cation-poor environment that
receives no significant inflow and therefore has no significant outflows. Acids
generated during the decomposition of organic matter create a low pH environment.
In the marsh, a stream provides a constant influx of cations, which buffer
the organic acids. The pH in the marsh soils ranged from 4.8–6.1. In stark contrast,
the pH in fen soils ranged from 3.7–4.1.
Redox potential
Eh values in the scrub-shrub wetland (Fig. 3) were variable with the lowest
readings occurring in the wetter spring months, indicating a higher water table
and the presence of reducing conditions. In the drier summer months and colder
winter months, the increased redox potential (>175 mV) indicates that the soil
was not reduced. The higher redox potential is the result of a lower water table
in summer and decreased microbial activity in the winter months, and helps
to explain the presence of a minimal organic layer (7 cm) in the scrub-shrub
wetland soils. Organic matter accumulates when persistent reducing conditions
are present, but under variable reducing conditions, such as those present in
the scrub-shrub wetland, organic materials undergo increased decomposition.
Furthermore, these soils contained mottles near the surface, which are expected
when a fluctuating water table is present.
The soils in Railroad Grade were reduced throughout the entire study period
with all Eh values consistently less than 175 mV (Fig. 3). The lower Eh values we observed
are not surprising given the 38-cm accumulation of organic material. Yet,
the Eh fluctuated as the redox potential increased in August and September of
2002 when the water table is normally the lowest.
The most reduced soil in the study was that of the Elder Swamp fen-marsh
area (Fig. 3). Except for December 2001 and January 2003, all values for Eh
were less than -200 mV, indicating strong reducing conditions that favor organic
Southeastern Naturalist
K. Stephens, J. Sencindiver, and J. Skousen
2015 Vol. 14, Special Issue 7
54
Figure. 3. Redox potential for fifteen months at 20–cm depth in three wetland soils of the Beaver Creek watershed. Redox potentials expressed
as the mean of values from six redox electrodes; values are adjusted to a soil pH reference value of 7.
Southeastern Naturalist
K. Stephens, J. Sencindiver, and J. Skousen
2015 Vol. 14, Special Issue 7
55
matter accumulation. These findings correspond to the 94 cm of organic material
observed in the fen-marsh wetland (Table1).
Conclusions
Soils have developed under different conditions in each wetland, leading to
variation in soil properties among wetlands. Some wetlands contain Histosols
that have been developing for extended periods of time, and other wetlands contain
young, undeveloped fill material. The fen-marsh wetland in Elder Swamp
consisted mainly of Histosols formed by years of organic matter accumulation via
reduced decomposition rates. Redox potential data from the fen-marsh site confirm
the presence of year-round strong reducing conditions, which favor organic
matter accumulation. Upslope from the fen-marsh wetland is the drier transitional
wetland with lower total C values. Soils in the transitional wetland are subjected
to a fluctuating water table, which has resulted in mottles, thin organic layers, and
variable redox conditions. The alder thicket soil is much wetter than the soil in the
transitional wetland but it is not as saturated as the fen-marsh soil. However, organic
material is accumulating in the alder thicket wetland, as evidenced by the high
C content of the mineral layers. Elder Swamp was the only wetland considered to
be completely unimpacted by mining activities and AMD. Sediments and AMD
from mine spoils impacted the other wetlands: mine spoils border Narrow Wetland
on the western edge and an AMD seep was adjacent to one sampling point, which
resulted in high S values and low soil pH. Additionally, hydrology in Narrow Wetland
was altered by the construction of Rt. 93, which dammed the water creating
saturated conditions. As a result, organic matter is beginning to accumulate. Iron
Pond is severely impacted by mine spoils. The soil in this wetland consisted of fill
material in the subsurface with thick, low pH, Oi horizons present at the surface.
Very little soil development was observed in this wetland, yet a diverse vegetative
community is growing in Iron Pond. Railroad Grade is partially impacted. The impacted
soils had high S values, and contained sediments from nearby mine spoils.
The non-impacted soils have thick organic layers, but are not yet Histosols. We
believe that the nearby railroad grade is impeding drainage so these soils are in the
process of accumulating organic materials.
Acknowledgments
This research was supported by funds provided by the West Virginia Division of
Highways, Charleston, WV and the West Virginia Agricultural and Forestry Experiment
Station, Morgantown, WV. We appreciate the assistance of Dr. R. Fortney and Dr. R.
Viadero in completing this research.
Literature Cited
Appalachian Regional Commission. 1969. Acid mine drainage in Appalachia. Congressional
House Document 91-180. Vol. I–III. Appendix C. Appalachian Regional Commission,
Washington, DC.
Southeastern Naturalist
K. Stephens, J. Sencindiver, and J. Skousen
2015 Vol. 14, Special Issue 7
56
Chambers, D.B. 1996. Physical, chemical, and biological data for four wetland habitats
in Canaan Valley, WV. US Geological Survey. Open-File Report 95-334. 23 pp.
Environmental Laboratory. 1987. Corps of Engineers wetlands delineation manual. Technical
Report. Y-87-1. US Army Engineer Waterways Experiment Station, Vicksburg,
MI. 98 pp. plus appendices
Faulkner, S.P., and W.H. Patrick, Jr. 1992. Redox processes and diagnostic wetland
indicators in bottomland hardwood forests. Soil Science Society of America Journal
56:856–865.
Faulkner, S.P., W.H. Patrick, and R.P. Gambrell. 1989. Field techniques for measuring
wetland soil parameters. Soil Science Society of America Journal 53:883–890.
Fuhrmann., J.J. 1998. Microbial metabolism. Chapter 10. Pp. 189–217, In D.M. Sylvia,
J.J. Fuhrmann, P.G. Hartel, and D.A. Zuberer (Eds.). Principles and Applications of
Soil Microbiology. Prentice-Hall, Inc. Upper Saddle River, NJ. 695 pp.
Gambrell, R. ., and W.H. Patrick, Jr. 1978. Chemical and microbiological properties of
anaerobic soils and sediments. Pp. 375–423, In D.D. Hook and R.M. Crawford (Eds.).
Plant Life in Aerobic Environments. Ann Arbor Science Publication, Incorporated,
Ann Arbor, MI. 564 pp.
Geidel, G., and F.T. Caruccio. 2000. Geochemical factors affecting coal mine drainage
quality. Pp. 105–130. In R.I. Barnhisel, R.G. Darmody, and W.L. Daniels (Eds.). Reclamation
of Drastically Disturbed Lands. American Society of Agronomy, Madison,
WI. 1082 pp.
Howeler, R.H., and D.R. Bouldin. 1971. The diffusion and consumption of oxygen in
submerged soils. Soil Science Society of America Journal 35:202–208.
Kararthanasis, A.D., Y.L. Thompson, and C.D. Barton. 2003. Long-term evaluations of
seasonally saturated “wetlands” in western Kentucky. Soil Science Society America
Journal 67:662–673.
McLatchey., G.P., and K.R. Reddy. 1998. Regulation of organic matter decomposition
and nutrient release in a wetland soil. Soil Science Society of America Journal
27:1268–1274.
Mitsch W.J., and J.G. Gosselink. 2000. Wetlands. 3rd Edition. John Wiley and Sons, Inc.
New York, NY. 936 pp.
National Technical Committee for Hydric Soils. 2004. The Hydric Soil Technical Standard.
Hydric Soil Technical Note 11. USDA Natural Resources Conservation Service.
Washington, DC. 23 pp. Available online at ftp://ftp-fc.sc.egov.usda.gov/NSSC/Hydric_
Soils/HSTS.pdf. Accessed 8 December 2004.
Pickering, E.W., and P.L.M. Veneman. 1984. Moisture regimes and morphological
characteristics in a hydrosequence in central Massachusetts. Soil Science Society of
America Journal 48:113–118.
Ponnamperuma, F.N. 1972. The chemistry of submerged soils. Advanced Agronomy
24:29–96.
Rabenhorst, M.C., and K.C. Haering. 1989. Soil micromorphology of a Chesapeake Bay
tidal marsh: Implications for sulfur accumulations. Soil Science 147:339–347.
Skousen, J.G., A. Sexstone, and P.F. Ziemkiewicz. 2000. Acid mine drainage control and
treatment. Pp. 131–168. In R.I. Barnhisel, R.G. Darmody, and W.L. Daniels (Eds.).
Reclamation of Drastically Disturbed Lands. American Society of Agronomy, Madison,
WI. 1082 pp.
Soil Survey Division Staff. 1993. Soil Survey Manual. USDA Handbook No. 18. US
Government Printing Office. Washington, DC. 315 pp.
Southeastern Naturalist
K. Stephens, J. Sencindiver, and J. Skousen
2015 Vol. 14, Special Issue 7
57
Soil Survey Staff. 1996. Soil Survey Laboratory Methods Manual. Soil Survey Investigations
Report No. 42. Version 3.0 National Soil Survey Center, Lincoln, NE. 716 pp.
Stephens, K. 2003. Characterization of wetland soils in the Beaver Creek watershed.
M.Sc. Thesis. West Virginia University, Morgantown, WV. 131 pp. Available online
at http://kitkat.wvu.edu:8080/files/2864.1.Stephens_Kyle_thesis.pdf.
USDA-NRCS. 1995. Changes in hydric soils of the US. Federal Register, Volume 60 (37)/
Friday, 24 February, P. 10,349. US Government Printing Office. Washington, DC.
West Virginia University. 1995. Corridor H/ Blackwater River restoration. Unpublished
report submitted to the West Virginia High Technology Consortium, WVHTC-FS95-
1011. Report is available from the West Virginia University National Research
Center for Coal and Energy, Morgantown, WV. 45 pp.


 The Southeastern Naturalist is a peer-reviewed journal that covers all aspects of natural history within the southeastern United States. We welcome research articles, summary review papers, and observational notes.