Southeastern Naturalist
F. Levy and E.S. Walker
2014
46
Vol. 13, Special Issue 6
Pattern and Rate of Decline of a Population of Carolina
Hemlock (Tsuga caroliniana Engelm.) in North Carolina
Foster Levy1,* and Elaine S. Walker2
Abstract - We monitored a population of Carolina Hemlocks in northwestern North Carolina
for four years to examine the rate and pattern of decline in response to infestation by
Adelges tsugae (Hemlock Woolly Adelgid). Our yearly census of hemlock condition and
severity of the adelgid infestation included trees of all sizes. We estimated declines in
condition as the portions of the leaf canopy that were lost. Initially, infestation occurred
throughout the population but was severe in only a small cluster of individuals. Within 1
year, the area of severe infestation increased in size to encompass 48% of the population.
In another region of the population, there was a cluster of relatively healthy individuals
comprised largely of seedlings. Of the 4 size-classes of trees, sapling-sized individuals experienced
the highest rates of decline in condition. Most trees declined to poor health within
3 years of an observation of moderate to severe infestation.
Introduction
With the exception of upper Piedmont outlier populations, Tsuga caroliniana
Engelm. (Carolina Hemlock) is endemic to the Blue Ridge physiographic province
of the southern Appalachian Mountains from southwestern Virginia to northern
Georgia (Jetton et al. 2008, Rentch et al. 2000). While in some areas, the 2 hemlock
species of eastern North America— Carolina Hemlock and Tsuga canadensis (L.)
Carrière (Eastern Hemlock)—exist in sympatry, artificial hybridization and DNAbased
molecular data suggest a closer relationship of Carolina Hemlock to Asian
hemlocks than to Eastern Hemlock (Bentz et al. 2002, LePage 2003, Pooler et al.
2002). Ecologically, Carolina Hemlock tends to inhabit drier and more exposed
sites, such as rocky ridges overlain by acidic, sandy clay loam soils, than the shaded
lowlands and moist coves preferred by Eastern Hemlock (Jetton et al. 2008).
Few studies have examined Carolina Hemlock population and community
structure. At 2 locations where age structure was analyzed using tree cores—Bluff
Mountain, Ashe County, NC, and Bottom Creek Gorge, Montgomery County, VA—
some trees exceeded 30 cm diameter at breast height (dbh) and 220 years of age
(Humphrey 1989, Rentch et al. 2000). There was a linear relationship between tree
diameter and age at both locations. However, the pattern of seedling recruitment
and the population age structure varied widely across populations. For example,
populations at Linville Falls, NC, and 3 sites examined at Bluff Mountain had negative
exponential age-class distributions characteristic of stable age distributions
(Humphrey 1989, Levy et al. 2008). In contrast, the population at Bottom Creek
1Department of Biological Sciences, East Tennessee State University, Johnson City, TN
37614. 2Department of Internal Medicine, James H. Quillen College of Medicine, East Tennessee
State University, Johnson City, TN 36514. *Corresponding author - levyf@etsu.edu.
Manuscript Editor: Justin Hart
Forest Impacts and Ecosystem Effects of the Hemlock Woolly Adelgid in the Eastern US
2014 Southeastern Naturalist 13(Special Issue 6):46–60
Southeastern Naturalist
47
F. Levy and E.S. Walker
2014 Vol. 13, Special Issue 6
Gorge had a normal age distribution with a relative dearth of seedlings. Similarly,
seedlings were absent or rare at 2 sites in eastern Tennessee (Levy et al. 2008).
These studies pre-dated major impacts and loss of Carolina Hemlock trees due to
Adelges tsugae Annand (Hemlock Woolly Adelgid [HWA]) infestations.
Whereas many studies have focused on the impact of HWA on Eastern Hemlock,
relatively little quantitative information exists for impacts on Carolina Hemlock. The
exception was a baseline study of HWA impacts on Carolina Hemlock in western
North Carolina and eastern Tennessee in which each of 4 populations showed a spatial
pattern of infestation and hemlock decline characterized by 1 or more clusters
of diseased trees and clusters of healthy trees (Levy et al. 2008). Although congeneric
with Eastern Hemlock, the rate and pattern of decline in response to HWA may
differ between the species because Carolina Hemlock in the southern Appalachians
tends to inhabit drier, more nutrient-poor sites (Humphrey 1989, Jetton et al. 2008).
Further, the geographic range of Carolina Hemlock is largely restricted to the southern
Appalachians, a region where decline in Eastern Hemlock has been most severe
(Evans et al. 2011). The impending loss of natural populations of Carolina Hemlock
and the paucity of quantitative information on population structure and HWA impacts
will impede conservation planning and management efforts, including setting
re-introduction targets.
The goal of this study was to examine the rate of Carolina Hemlock decline and
the pattern of spread of HWA in a multi-year analysis of a single population. This
approach was feasible because the study population was relatively small, with less
than 200 individuals, and the spatial boundaries were well defined. Moreover, the
population was isolated from other populations by a distance of at least 5 km. We
conducted annual monitoring and assessment of hemlock tree condition and HWA
infestation metrics over a period of 4 years, commencing soon after HWA was first
observed in the population.
Field Site Description
We selected a population of Carolina Hemlock where we could conduct annual
demographic monitoring from 2007 to 2010. The population is adjacent to the Fodder
Stack Trail in Doughton Park, Allegheny and Wilkes County, NC on a narrow
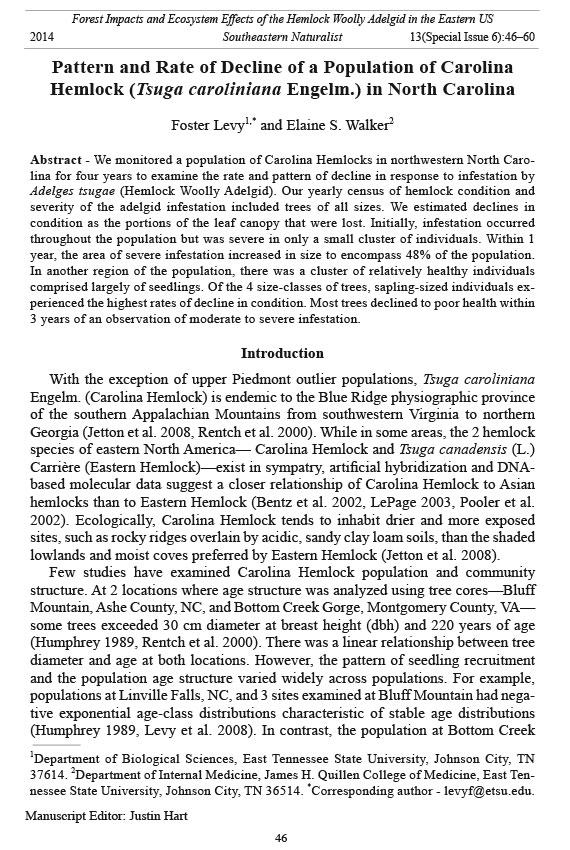
southeast–northwest-trending ridge (81°10.126'W, 36°25.770'N) at 1100 m elevation
(Fig. 1). Slopes on the ridge are negligible. The site is within the jurisdiction
of the Blue Ridge Parkway and is located near Milepost 241. The overstory of the
site is dominated by Carolina Hemlock with minor representation by Quercus montana
Willd. (Chestnut Oak), Acer rubrum L. (Red Maple), Nyssa sylvatica Marshall
(Blackgum), and Oxydendrum arboreum (L.) DC. (Sourwood). Where the stand is
dense, few other woody species are present in the overstory or the understory. The
census population varied from 101–138 individual Carolina Hemlocks, with differences
in numbers largely dependent upon seedling turnover. The maximum dbh of
Carolina Hemlock at the site was 30 cm. This size corresponds to 75–175 years
of age based on the linear regression of age on dbh in Rentch et al. (2000) or to approximately
125 years of age based on the plot of dbh and age in Humphrey (1989).
Southeastern Naturalist
F. Levy and E.S. Walker
2014
48
Vol. 13, Special Issue 6
The study terminated when the infestation had progressed to the point where 1 tree
had died and access to the site was limited by multi-year closure of the Blue Ridge
Parkway for repairs.
Methods
Population census
We conducted a population census in early September each year, from 2007–
2010. To assess spatial structure in the population, we noted the location of each
individual as x-axis coordinates along a 100-m transect that followed the spine
of the ridge, with y-axis coordinates extending perpendicular to the transect for a
maximum of 20 m on either side. This transect captured all Carolina Hemlocks except
those on steep slopes off the ridge. Trees included in the census accounted for
>90% of the individuals in the population that were larger than 1 m in height. This
estimate was based on visual inspection to identify unsampled larger individuals,
but without ground verification it was difficult to ascertain if pockets of high seedling
density were present in unvisited areas on steep slopes. No Eastern Hemlocks
were present in the immediate vicinity.
We recorded the following data for each individual: spatial location as x and y
coordinates, height, dbh, and 3 indicators of disease—tree condition, number of
Figure 1. Field site, bounded by the black rectangle, located on a ridge in Doughton State
Park, NC. Blue Ridge Parkway labeled as Parkway. Contour interval = 12.2 m (40 ft).
US Geological Survey, Whitehead Quadrangle, NC [map]. Photorevised 1998. 1:24,000.
7.5-minute series. United States Department of the Interior , USGS, Reston, VA 1998.
Southeastern Naturalist
49
F. Levy and E.S. Walker
2014 Vol. 13, Special Issue 6
quadrants infested (for individuals >0.30 m in height), and infestation density. We
assessed tree condition on a 5-point scale corresponding generally to the proportion
of the tree with healthy foliage, scaled in 20% increments. For ease of interpretation,
we will refer to these categorical numerical values, ranging from high to low,
as excellent, good, fair, poor, and near dead. The scale is similar to ones used in
comparable studies (Eschtruth et al. 2006, Evans et al. 2011, Orwig and Foster
1998, Rentch et al. 2000, Royle and Lathrop 1997). We determined the number of
quadrants of a tree infested based on a visual examination for HWA egg cases on
accessible foliage in each of the cardinal directions. We scored the observation of
any HWAs in the quadrant as positive regardless of density; the scale range was
0–4 quadrants. Infestation density was a visual estimate based on the density of
egg cases graded on a 4-point scale with zero corresponding to no egg cases and
3 corresponding to confluence of egg cases along undersides of twigs. For ease of
interpretation, we will refer to these categorical numerical values ranging from no
infestation to dense infestation as no, light, moderate, and heavy infestations. We
made our HWA estimates with the understanding that HWA distribution varies with
tree-crown position (Evans and Gregoire 2007). As a group, the 3 disease-indicator
traits provided estimates of the magnitude and distribution of insects on the tree and
of the tree’s overall condition. Two researchers assessed these 3 variables independently.
In most cases, the results of separate assessments were identical. For those
assessments that were not in agreement, values usually differed by no more than
1 scale unit, in which case consensus was arrived at after re-examination. When
multiple researchers examined satellite images to assess canopy condition, separate
assessments had a similar level of precision (Royle and Lathrop 1997). In the few
instances where assessments differed by more than one scale unit, we conducted
reassessments until we reached consensus.
Data analysis
We employed 2 approaches to understand spatial structure of the HWA infestation
and the condition of Carolina Hemlocks, each applied to tree-height data
and to data from each census year separately for each of the 3 disease-indicator
variables. Tree height and dbh were strongly correlated (Pearson correlation coefficient
= 0.94; P = 0.001). We used only tree height in our analyses because height
data included all individuals, whereas dbh omitted those shorter than breast height.
First, we conducted spatial autocorrelation to examine population-wide patterns
of similarity by using Moran’s I statistic as implemented with Spatial Analyses in
Macroecology (v 4.0) software and running 1000 permutations to estimate significance
(Rangel et al. 2010). We assigned individuals to 5 equal distance-classes to
provide insight into the magnitude and sign of autocorrelations at different distances.
Second, we conducted cluster analysis based on the scan statistic as carried out
using SaTScan software to examine patterns of local aggregations (Kulldorff and
Information Management Services, Inc. 2009). This method identifies clusters of
individuals whose trait values are significantly higher or lower than the remainder
of the population. In regard to HWA infestation, this approach generates clusters
Southeastern Naturalist
F. Levy and E.S. Walker
2014
50
Vol. 13, Special Issue 6
of relatively more or less infested individuals, and for tree condition, clusters of
individuals in relatively better or poorer condition, hereafter referred to as health
or disease clusters, respectively. We based analyses on an ordinal model with 1000
Monte Carlo simulations used to assess significance. When significant clusters of
disease-indicator traits were identified, an analysis of frequencies was used to determine
whether any size class was more common in the cluster compared to the
remainder of the population. We assessed significance using Fisher’s exact test of
2 x 2 contingency tables in which rows corresponded to the individuals either in or
out of the cluster and columns represented the size class of interest versus individuals
in all other size classes.
We conducted analyses of frequencies using Fisher’s exact tests to determine
whether there were significant temporal changes in the distribution of each disease
indicator. First, all years were compared in a single analysis followed by pairwise
comparisons of years. Separate analyses were conducted for each of the three disease
indicators. For each year and each disease indicator, we also used exact tests
to assess differences in the distribution of responses among height classes.
We used logistic regression to examine the influence and potential interactions
of height and transect location on disease. Separate analyses were conducted on
each of the 3 disease indicator variables for each of the 4 census years. Predictor
variables were x and y coordinates and tree height class. Heights were aggregated
into 4 categories as follows: ≤0.3 m, 0.3–2.4 m, 2.5–6.1 m, and >6.1 m. With
the caveat that Carolina Hemlocks can withstand long periods of time as slowgrowing
understory plants, these height categories broadly correspond to, and for
convenience are referred to, as seedlings, saplings, small trees, and large trees,
respectively. We treated tree height class and each of the disease indicators as categorical
variables and the transect x and y coordinates as continuous variables.
Results
The population age structure at Doughton Park had a negative exponential shape
with a broad base comprised of 78 seedlings representing 48% of the population.
Larger size classes each had progressively fewer individuals: 38 saplings (23%),
28 small trees (17%), and 20 large trees (12%). At the onset of the study in 2007,
impacts from HWA were minor: 68% and 30% of individuals were in excellent
and good condition, respectively; 33% and 54% had no and light infestations, respectively;
and 34% and 21% had 0 or 1 quadrant infested, respectively (Table 1,
Fig. 2). The 2 infestation indicators peaked in 2008 and then declined in each of
the following 2 years while tree condition declined progressively. By 2010, 50% of
the individuals were in excellent or good condition, and 50% were in fair or poor
condition (Fig. 2). Each year, seedlings had the highest proportion of individuals
in excellent condition, while saplings tended to have the highest proportions in fair
and poor condition (Fig. 3).
For each of the 3 disease indicators, the distribution of individuals among the
response categories differed significantly between all pairs of years and when all 4
years were considered together (P < 0.001 for each analysis). Similarly, each year
Southeastern Naturalist
51
F. Levy and E.S. Walker
2014 Vol. 13, Special Issue 6
Table 1. Characteristics of the entire population and disease and health clusters for three disease-indicator traits over four years: tree condition (ex =
excellent, gd = good, fr = fair, pr = poor); infestation density (no = none, lt = light, mo = moderate, hv = heavy); and quadrants infested (0–4 scale). All
clusters were significant at P < 0.05. n = number of individuals, Med = median.
2007 2008 2009 2010
Indicator Type n Med Mode n Med Mode n Med Mode n Med Mode
Tree condition Disease 19 gd gd 63 gd gd 13 fr pr 20 fr fr
Health 16 ex ex 24 ex ex
Population 130 ex ex 126 gd gd 101 gd gd 139 gd gd
Infestation density Heavy 57 mo hv 12 mo mo
Light 17 no no 46 lt mo 44 no no
Population 123 lt lt 119 mo mo 97 lt lt 132 no no
Quadrants infested High 29 4 4
Low 11 2 0
Population 71 2 4 67 4 4 66 3 4 75 0 0
Figure 2. Distributions of numbers of
individuals over time in various categories
of, (a) condition, (b) infestation,
and, (c) quadrants infested.
Southeastern Naturalist
F. Levy and E.S. Walker
2014
52
Vol. 13, Special Issue 6
the response distributions of each disease indicator differed significantly among
tree height classes (P < 0.001 for each analysis) (Fig. 3).
An examination of individual tree responses to disease can provide insight into
the rate of decline. Other than seedlings, only 1 tree died during the study: a 1.5-
m tall individual that began the study in the good condition class but each year
dropped 1 condition class and was deceased by 2010. Seventeen trees declined
from excellent to fair condition, a group that included individuals of all size classes
except large trees. Only 6 of these declining trees had moderate to heavy infestations
prior to reaching the fair condition class. Sixteen trees progressed to poor
condition, 9 from excellent and 7 from good condition; 11 of the 16 were saplings.
Six individuals maintained excellent condition for the 4-year duration: 5 seedlingsized
individuals, and 1 large tree that was most isolated from the remainder of the
population. We observed no HWA on that tree nor on 2 of the seedlings at any time.
Figure 3. Distributions of individuals in four condition categories (excellent, good, fair ,
poor ) from 2007–2010.
Southeastern Naturalist
53
F. Levy and E.S. Walker
2014 Vol. 13, Special Issue 6
Spatial patterns
Spatial autocorrelation. There was a significant positive spatial autocorrelation
in tree height among pairs of individuals at the farthest distance class (Moran’s I =
0.37, P = 0.03). Thus, individuals farthest from each other were likely to be similar
in height, an effect largely caused by some large trees at both ends of the transect.
The far-distance effect disappeared when 3 large trees that were relatively isolated
at the southeast end of the transect were removed from the analysis. Spatial autocorrelations
for disease-indicator traits were not sensitive to the presence or absence
of the isolated trees. In 2007, there were no significant autocorrelations for any of
the 3 disease-indicator traits. However, by 2008 and 2009, all 3 disease-indicators
had moderately strong, negative autocorrelations at the farthest distance class (Moran’s
I = -0.35 to -0.41), a pattern that indicated individuals far from each other
were likely to differ in condition and infestation characteristics. The duration of
the autocorrelation for the far distance class was different among indicator traits,
with infestation density losing significance after one year, while significance for
number of quadrants infested persisted for 2 years, and the autocorrelation for tree
condition decreased in strength but remained significant until 2010. For the nearest
distance class, all 3 indicator-traits showed a small but significant positive autocorrelation
that began in 2008 and lasted until 2009 (infestation density, number
of quadrants infested) or 2010 (tree condition) (Moran’s I = 0.02–0.04, P < 0.01
for each). The positive autocorrelation indicated individuals near each other were
likely to be similar for the trait considered.
Cluster analysis of height. In 2007, 2008, and 2010, aggregations of seedlings
in one region were manifested as seedling-dominated clusters of varying numbers
of individuals (Table 2). Seedlings represented 76–91% of the individuals in these
clusters. In 2009, there was a cluster that had nearly equal representation of seedlings
and saplings, and in 2010, there was a cluster dominated by saplings with
lesser representation of small and large trees and an absence of seedlings (Table 2).
Cluster analysis of tree condition. At the first census, in 2007, a disease cluster
was detected (Fig. 4). Over the 4 census years, the percentages of trees in excellent
Table 2. Characteristics of clusters for height (m). All clusters were significant at P < 0.05. Mean =
cluster mean; n = number of individuals in the cluster; SEM = standard error of the mean.
Mean
(n, SEM)
Trait/cluster Type 2007 2008 2009 2010
Height
Seedling-dominated 2.01 0.66 1.10
(51, 0.41) (22, 0.41) (42, 0.33)
Seedling and sapling-dominated 0.67
(18, 0.14)
No seedlings 4.43
(23, 0.81)
Entire population 2.90 2.79 3.36 2.69
(130, 0.31) (131, 0.31) (101, 0.35) (138, 0.30)
Southeastern Naturalist
F. Levy and E.S. Walker
2014
54
Vol. 13, Special Issue 6
Figure 4. Plots showing locations
of unclustered individuals
in the population
(open diamonds), individuals
in disease clusters (red
triangles), and individuals
in health clusters (green
squares) for 2007–2010.
From left to right, the xaxis
represents a southeast to
northwest transect.
Southeastern Naturalist
55
F. Levy and E.S. Walker
2014 Vol. 13, Special Issue 6
and good condition in this cluster declined from 21% and 67%, respectively, to 0%
and 5%, respectively. The rate of decline in condition in the cluster outpaced that in
the population as a whole, which declined from 38% and 30% in excellent and good
conditions, respectively, to 18% and 32%, respectively. The differences in the rates
of decline were also reflected in differences in declines in the cluster and population
medians and modes (Table 1). The disease cluster was numerically dominated
by saplings and remained in a relatively stable location throughout the duration of
the study, but its size increased dramatically in 2008 before returning to lower levels
for the 2 ensuing years (Fig. 4). Over the 4 census years, saplings represented
40–60% of individuals in the disease cluster but only 25–33% of the population.
The differences in sapling frequencies between the cluster and the remainder of the
population were significant each year (P < 0.03 each year).
In a different location, a health cluster appeared in 2008, it was not significant in
2009, but returned and was present in a similar location in 2010 (Table 2, Fig. 4).
Seedlings comprised 100% and 79% of this cluster in 2008 and 2010, respectively,
during which time seedlings comprised 38% and 42% of the population, respectively.
Each year, seedling frequencies were significantly higher in the cluster compared
to the remainder of the population (P < 0.0001 each year).
There was overlap in membership in the condition and height clusters. For
example, 96% and 100% of the individuals in the 2008 and 2010 health clusters,
respectively, were encompassed in the seedling-dominated height clusters present
in those years, but the height clusters also included several individuals that were
not part of the health cluster (Table 1). Similarly, in 2009, 77% of the individuals in
the disease cluster were part of the seedling and sapling-dominated height cluster,
and in 2010, 80% of the individuals in the disease cluster were members of the no
seedlings height cluster (Table 2).
Cluster analysis of infestation density. In 2007, there was a cluster of uninfested
to lightly infested individuals comprised of 13 seedlings and 4 large trees (Table 1).
The majority of individuals in the population in 2008 were members of either a light
or heavy infestation cluster, with 46 and 57 members representing 35% and 43% of
the population, respectively. The location of the light and heavy infestation clusters
corresponded to the southeast and northwest regions of the transect, respectively. A
light infestation cluster of 44 individuals appeared again in 2010. Infestation densities
peaked in 2008 when 27 individuals had heavy infestations (Table 1). Saplings
comprised 17 of the individuals in this group that included only two seedlings and
two mature trees. Of the 27 individuals with heavy infestations, 10 eventually declined
to poor condition and another 10 to fair condition.
Cluster analysis of quadrants infested. After an absence of clusters for quadrants
infested in 2007, in 2008 there was a cluster of 29 individuals with high numbers
of quadrants infested (Table 1). In 2009, there was a small cluster of 11 individuals
with relatively few quadrants infested comprised exclusively of large trees and
located at the southeast end of the transect.
Rate of Decline. Rates of decline were not uniform among individuals in different
size classes. Disease was most severely manifested in sapling-sized individuals
Southeastern Naturalist
F. Levy and E.S. Walker
2014
56
Vol. 13, Special Issue 6
as evidenced by the highest rate of decline in condition among size classes (Fig. 3).
Moreover, saplings comprised a disproportionate share of the individuals in the
disease cluster. For example, in 2008 when the disease cluster was at its maximum
size, saplings represented 40% of the cluster but only 25% of the entire population.
Logistic regressions showed that height class was a significant predictor of tree
condition and infestation density for 2008–2010, but in each of those years, there
was also a significant interaction between height class and posi tion on the transect
x-axis. In 2009, the numbers of quadrants infested similarly showed significance
for height class and the height class by x-axis interaction. The interaction shows
that the magnitude of the disease indicator traits was dependent upon both the location
of an individual and its size. Neither position on the transect y-axis nor any of
the other potential interactions were significant for any of the disease indicators at
any year.
Discussion
As a species with 2 of the 3 defining characteristics of rare species (Rabinowitz
1981), a narrow geographic range and a specialized habitat preference, Carolina
Hemlock is likely more prone to local and global extinction than the more
widespread Eastern Hemlock. Unlike Eastern Hemlock populations that are often
ill-defined because they tend to follow water courses and mountain coves, Carolina
Hemlock populations, which occur along ridges and outcroppings, tend to be more
discrete and more isolated from each other (Humphrey 1989, Jetton et al. 2008,
Rentch et al. 2000). Thus, for the third characteristic of rare species, low population
density (Rabinowitz 1981), populations of Carolina Hemlock are often relatively
small compared to the extensive areas dominated by Eastern Hemlock. In regard
to disease, population isolation may decrease the transmission of pathogens from
other populations, but once established, small population dynamics may lead to
more rapid loss of population viability.
Aside from seedlings, only one individual died over the 4-year duration of the
study. While no individuals progressed from excellent to poor condition, many declined
from good to poor condition in as little as 3 years. At these rates of decline
after an initial infestation, a minimum of 5 years is required for mortality, and most
trees can be expected to die or reach an irreversible state of decline in 5–10 y. This
estimate is greater than the 2–4-y time to death cited previously for Carolina Hemlock
(Jetton et al. 2008), but it is consistent with the 7-y time span from infestation
to mortality reported for Eastern Hemlock near the southern extent of the range
(Ford et al. 2012). Very few plants other than seedlings remained HWA-free or in
excellent condition, but as disease progressed in a non-random spatial pattern, at
least 1 area had a concentration of individuals that were significantly healthier and
less infested compared to the remainder of the population.
Population age and size structure may influence rates of hemlock decline. For
example, in 2008, when the disease cluster was at its maximum size (Fig. 4), saplings
represented 40% of the cluster but only 25% of the entire population. Stronger,
more rapid impacts on smaller trees were similarly observed in Eastern Hemlock
Southeastern Naturalist
57
F. Levy and E.S. Walker
2014 Vol. 13, Special Issue 6
where suppressed, smaller trees declined more rapidly compared to canopy trees
(Eschtruth et al. 2006, Orwig and Foster 1998, Rentch et al. 2009). At Doughton
Park, a similar process leading to weakened individuals in the low canopy may
have caused the most rapid decline in sapling-sized trees. Under an HWA-control
strategy based on soil application of chemical pesticides, the sapling size class is
logistically easiest and relatively inexpensive to treat, and if trees of this size are
healthy with a full canopy (rather than weak from suppression) and are treated early
in an infestation, they are more likely to respond to treatment than large trees (Webb
et al. 2003).
In contrast, seedlings at Doughton Park were most likely to be free of HWA and
in healthier condition. We noted the presence of new seedlings each year, a pattern
that suggests on-going reproduction and recruitment rather than the episodic
pattern noted in other populations (Humphrey 1989, Rentch 2000). Moreover,
seedlings dominated the clusters of healthy individuals. For example, the health
cluster of 2010 included 19 of 24 seedlings (79%) while seedlings represented only
25% of the population (Table 1). However, health clusters were not exclusively
seedlings—3 large trees were also part of the 2010 health cluster. Seedling-sized
individuals appeared to be the least likely size class to experience severe infestations,
in part because there was some seedling turnover each year, with deaths and
new recruitment. While studies of hemlock decline rarely report seedling condition,
abundance of Eastern Hemlock seedlings at sites in NJ and PA increased after
HWA infestation, but annual fluctuations in recruitment were also noted (Eschtruth
et al. 2006). In riparian sites across the range of Eastern Hemlock, seedling density
varied from zero to over 15,000/ha, with no seedlings noted for the three North
Carolina populations surveyed (Evans et al. 2011).
Population age structure can provide insight into the history of populations,
but this information was also deemed important to Carolina Hemlock gene conservation
efforts (Jetton et al. 2008). Each of the limited number of populations
of Carolina Hemlock for which age or size structure has been studied included
relatively old trees (>100 years of age; Humphrey 1989, Rentch et al. 2000). However,
age structure among these populations may vary widely and range from a
relative dearth or absence of seedlings to a preponderance of seedlings. At Bluff
Mountain, NC, clumps of even-aged individuals suggested episodic recruitment,
but the age structure at 3 of 4 sites indicated populations were stable (Humphrey
1989). Whereas no seedlings were found at Bottom Creek Gorge, VA, and the tree
size distribution was nearly normal, that population was also thought to undergo
episodic recruitment and was considered stable (Rentch et al. 2000). A more recent
study of Carolina Hemlocks showed 2 populations in eastern Tennessee with an
underrepresentation of seedlings and 2 populations in western North Carolina with
stable size distributions (Levy et al. 2008).
Even before major declines in Carolina Hemlock populations were noted, both
HWA infestation and hemlock decline occurred in foci rather than randomly in
populations (Levy et al. 2008). At Doughton Park, the size of the infestation cluster
increased rapidly over time but the cluster then disappeared (Table 1). In contrast,
Southeastern Naturalist
F. Levy and E.S. Walker
2014
58
Vol. 13, Special Issue 6
the disease cluster, while peaking in size in 2008, continued to appear as a significant
cluster for the duration of the study. It should be noted that cluster detection is
a relative metric. Thus, while the condition of trees in the disease cluster continued
to decline, the reduction in cluster size was not caused by a reversal of disease but
was most likely a consequence of a trend to declining health across the remainder of
the population. At the time that the disease cluster reached maximum size in 2008, a
cluster of relatively healthy plants appeared in a different region of the population,
and this cluster was again apparent 2010 (Table 1, Fig. 4).
As hemlocks decline, sectors of their canopies are lost, which reduces
amounts of new growth. Because HWA prefers new growth (Young et al. 1995),
a decrease in food quality is the likely cause of the decline in the HWA population.
Hence, changes in the hemlock hosts may account for the rapid increase and
then the rapid decline in the magnitude of the infestation density and size of the
infestation cluster. As HWA became widespread and reached high densities in
the population, previously unimpacted trees began to experience decline. Thus,
as the conditions of trees outside the disease cluster approached those within the
cluster, the cluster appeared to shrink in size, but the population as a whole continued
to decline.
Rates of hemlock decline cannot be estimated from examinations of populations
at single time points (Evans et al. 2011, Levy et al. 2008). However, in a
detailed long-term study of Eastern Hemlock initiated prior to HWA infestation,
the rate of decline of Eastern Hemlock was evaluated over a 10-year period at two
sites in the Delaware Water Gap National Recreation Area, NJ/PA (Eschtruth et
al. 2006). After initial detection of HWA, there was a lag of several years before
infestations reached an occurrence rate of >5% of twigs infested. At 1 site, the
percentage of trees that died or showed severe decline increased approximately
30% in one year (1999–2000), from <5% to >35%, but at the second site, trees in
those 2 condition categories remained below 10% for the duration of the study.
While the rate of decline may have both site-specific and species-specific components,
the effects of different site characteristics on decline are not clear (Rentch
et al. 2009). Rather, levels of infestation were the most accurate predictors of decline
(Rentch et al. 2009).
Landscape-scale analyses, such as those based on data from remote sensing,
have been used to document changes in canopy cover and differences among sites
experiencing hemlock decline (Koch et al. 2006, Royle and Lathrop 1997). In combination
with spatial autocorrelation analysis, this approach showed populations in
proximity tended to be similar in levels of infestation and decline in condition (Orwig
et al. 2013). However, a more detailed ground-based evaluation of individuals
is usually necessary to uncover patterns of disease progression within populations.
The analyses at Doughton Park showed that there are also spatial patterns of infestation
and disease within a population. Thus, pattern analysis at both the landscape
and population level may be useful and complementary in guiding management
strategies (Vose et al. 2013).
Southeastern Naturalist
59
F. Levy and E.S. Walker
2014 Vol. 13, Special Issue 6
Acknowledgments
We thank J. Donaldson, R. Ingram, and an anonymous reviewer for helpful comments
on the manuscript, the National Park Service for permission to conduct this work on their
property, and the Appalachian Highlands Science Learning Center for initial funding.
Literature Cited
Bentz, S.E., L.G. Riedel, M.R. Pooler, and A.M. Townsend. 2002. Hybridization and selfcompatibility
in controlled pollinations of eastern North American and Asian hemlock
species. Journal of Arboriculture 28:200–205.
Eschtruth, A.K., N.L. Cleavitt, J.J. Battles, R.A. Evans, and T.J. Fahey. 2006. Vegetation
dynamics in declining Eastern Hemlock stands: 9 years of forest response to Hemlock
Woolly Adelgid infestation. Canadian Journal of Forest Research 36:143 5–1450.
Evans, A.M., and T.G. Gregoire. 2007. The tree-crown distribution of Hemlock Woolly
Adelgid, Adelges tsugae (Hem., Adelgidae) from randomized branch sampling. Journal
of Applied Entomology 131:26–33.
Evans, D.M., W.M. Aust, C.A. Dolloff, B.S. Templeton, and J.A. Peterson. 2011. Eastern
Hemlock decline in riparian areas from Maine to Alabama. Northern Journal of Applied
Forestry 28:97–104.
Ford, C.R., K.J. Elliott, B.D. Clinton, B.D. Kloeppel, and J.M. Vose. 2012. Forest dynamics
following Eastern Hemlock mortality in the southern Appalachians. Oikos 121:523–536.
Humphrey, L.D. 1989. Life-history traits of Tsuga caroliniana Engelm. (Carolina Hemlock)
and its role in community dynamics. Castanea 54:172–190.
Jetton, R.M., W.S. Dvorak, and W.A. Whittier. 2008. Ecological and genetic factors that
define the natural distribution of Carolina Hemlock in the southeastern United States
and their role in ex situ conservation. Forest Ecology and Management 255:3212–3221.
Koch, F.H., H.M. Cheshire, and H.A. Devine. 2006. Landscape-scale prediction of Hemlock
Woolly Adelgid, Adelges tsugae (Homoptera: Adelgidae), infestation in the southern
Appalachian Mountains. Environmental Entomology 35:1313–1323.
Kulldorff, M., and Information Management Services, Inc. 2009. SaTScanTM v8.0: Software
for the spatial and space-time scan statistics. Available online at http://www.satscan.
org/. Accessed 25 January 2013.
LePage, B.A. 2003. A new species of Tsuga (Pinaceae) from the middle Eocene of Axel
Heiberg Island, Canada, and an assessment of the evolution and biogeographical history
of the genus. Botanical Journal of the Linnean Society 141:257– 296.
Levy, F., J. Baker, K. Chen, G. Cooke, Y-S. Liu, E.S. Walker, and T. McDowell. 2008.
Patterns of spread of Hemlock Woolly Adelgid. Pp. 168–176, In B. Onken and R. Readon
(Eds.). Proceedings of the 4th Hemlock Woolly Adelgid Symposium, Hartford,
CT. 339 pp.
Orwig, D.A., and D.R. Foster. 1998. Forest response to the introduced Hemlock Woolly
Adelgid in southern New England, USA. Journal of the Torrey Botanical Society
125:60–73.
Orwig, D.A., D.R. Foster, and D.L. Mausel. 2013. Landscape patterns of hemlock decline in
New England due to the introduced Hemlock Woolly Adelgid. Journal of Biogeography
29:1475–1487.
Pooler, M.R., L.G. Riedel, S.E. Bentz, and A.M. Townsend. 2002. Molecular markers used
to verify interspecific hybridization between hemlock (Tsuga) species. Journal of the
American Society for Horticultural Science 127:623–627.
Southeastern Naturalist
F. Levy and E.S. Walker
2014
60
Vol. 13, Special Issue 6
Rabinowitz, D. 1981. Seven forms of rarity. Pp. 205–217, In H. Synge (Ed.) The Biological
Aspects of Rare Plant Conservation. John Wiley and Sons, New York, NY. 558 pp.
Rangel, T.F., J.A. Diniz-Filho, and L.M. Bini. 2010. SAM: A comprehensive application for
spatial analysis in macroecology. Ecography 33:46–50.
Rentch, J.S., H.S. Adams, R.B. Coxe, and S.L. Stephenson. 2000. An ecological study of a
Carolina Hemlock (Tsuga caroliniana) community in Southwestern Virginia. Castanea
65:1–8.
Rentch, J., M.A. Fajvan, R.A. Evans, and B. Onken. 2009. Using dendrochronology to
model Hemlock Woolly Adelgid effects on Eastern Hemlock growth and vulnerability.
Biological Invasions 11:551–563.
Royle, D.D., and R.G. Lathrop. 1997. Monitoring hemlock forest health in New Jersey
using Landsat TM data and change detection techniques. Forest Science 43:327– 335.
Vose, J.M., D.N. Wear, A.E. Mayfield III, and C. Dana Nelson. 2013. Hemlock Woolly
Adelgid in the southern Appalachians: Control strategies, ecological impacts, and potential
management responses. Forest Ecology and Management 291:209–219.
Webb, R.E., J.R. Frank, and M.J. Raupp. 2003. Eastern Hemlock recovery from Hemlock
Woolly Adelgid damage following imidacloprid therapy. Journal of Arboriculture
29:298–301.
Young, R.F., K.S. Shields, and G.P. Berlyn. 1995. Hemlock Woolly Adelgid (Homoptera:
Adelgidae): Stylet bundle insertion and feeding sites. Annals of the Entomological Society
of America 88:827–835.


 The Southeastern Naturalist is a peer-reviewed journal that covers all aspects of natural history within the southeastern United States. We welcome research articles, summary review papers, and observational notes.