2007 SOUTHEASTERN NATURALIST 6(4):705–714
Marine Fish Diversity and Composition in the
Mid-Atlantic and South Atlantic Bights
Joseph W. Love1,* and Peter D. Chase2
Abstract - We sampled fishes from nearshore, continental shelf (≈30 m) to shelfslope,
deep-water habitats (≈100 m) in the Mid-Atlantic Bight (MAB) and South
Atlantic Bight (SAB) during winter (2005) to explore compositional differences
among temperatures and depths. Trawl surveys conducted by the National Marine
Fisheries Service do not typically sample winter fish assemblages concurrently from
both the MAB and SAB, although increased concern over changes in distribution of
species such as Pterois volitans (Lionfish) may warrant such studies. We collected 41
families and 68 species of fish, and found that temperature and depth influenced their
distribution. More species were collected in the SAB where temperature was 10 ºC
higher. At nearshore sites of SAB, we collected reef fishes (Chaetodontidae; Fistulariidae)
and Stenotomus chrysops (Scup). At deep water sites of SAB, we collected
Ophichthidae, Acropomatidae, and Scorpaenidae. Assemblages of the MAB were
dominated by Squalus acanthias (Spiny Dogfish), particularly at nearshore sites.
Pomatomus saltatrix (Bluefish) and Scomber scombrus (Atlantic Mackerel) were
also abundant in the MAB. Our results highlight distributions of some fish species
during winter. However, more data are necessary for understanding macroecological
patterns of marine fish distribution in the northwestern Atlantic Ocean, especially as
they relate to the interactive effects of temperature and depth on populations.
Introduction
One of the most dramatic temporal changes in the North Atlantic has
been the decline in the number of top predators over the past 100 years
(Christensen et al. 2001), especially shark populations. This decline can
result in changes in abundance and composition of lower trophic levels
(Kvitek et al. 1992) or diminished diversity (Paine 1966). “Fishing down
the food chain” may have affected population sizes and fishery interests for
fish species occupying lower trophic levels (Pauly et al. 1998). To better
protect and manage marine resources, fishery scientists are now exploring
ecosystem management options (Zabel et al. 2003) and marine protected
areas (Fogarty 2004). In addition to managing native populations (and communities),
marine researchers may be required to consider managing exotic
species that have recently invaded marine communities of the northwestern
Atlantic Ocean (Meister et al. 2005). Changes in distribution or population
size of higher trophic levels or invasive species introductions, as well as
global climate change, may interactively affect broad-scale, macroecological
1University of Maryland Eastern Shore, Living Marine Resources Cooperative Science
Center, Princess Anne, MD, 21853. 2National Marine Fisheries Service, Ecosystem
Surveys Branch, Woods Hole, MA, 02543. *Corresponding author - jlove@
umes.edu.
706 Southeastern Naturalist Vol.6, No. 4
patterns of marine fish assemblages. Unfortunately, there are broad gaps in
our understanding of marine fish distributions.
Macroecological patterns of marine fishes in the North Atlantic need
further elucidation (Floeter et al. 2004), but studies indicate that latitude
and depth explain patterns of diversity for teleosts and elasmobranchs
(Macpherson 2002, Macpherson and Duarte 1994) with the species-to-genus
ratio usually increasing closer to the equator (Floeter et al. 2004). The pattern
of diversity may be explained by greater habitat complexity, especially near
reefs (Floeter et al. 2004) or rocky shores (Ferreira et al. 2001) and thermal
refugia (Paull et al. 1984). The location of the gulf stream may also influence
the biomass or diversity of fishes because of its higher sea-surface temperature
that may provide thermal refugia or greater productivity for species.
Our study differs from earlier work by examining how species composition
differs between sites of the mid-Atlantic Bight (MAB) and the
South Atlantic Bight (SAB) of the northwestern Atlantic Ocean, in shelf
(≈30 m) and shelf-slope (≈100 m) habitats during winter. Our objectives
were to provide information on species distributions for fishes collected
during our winter survey (2005), and relate those distributions to depth
and water temperature.
Methods
We conducted a fish survey of 7 stations representing depth and temperature
variation from nearshore, continental shelf (≈30 m depth) to shelf-slope
(≈100 m depth) habitats between Delaware Bay and South Carolina during
winter (17 January–28 January 2005) aboard the NOAA vessel Albatross IV
(Table 1; Fig. 1). At most stations, we conducted multiple tows (see Table 1),
which were at least 1 km away from one other. In all, we conducted 14 tows
(hereafter, sites), 8 in the SAB and 6 in the MAB. Sites were chosen based
on a haphazard, random sampling design such that we sampled as many sites
as possible (within 2 weeks), while compromising with weather and meeting
other researchers’ needs aboard the vessel. Each site was sampled using
a Yankee Otter trawl for 30 minutes at 4 knots. For each site, fishes were
sorted, identified to species (Carpenter 2003, Hoese and Moore 1998, Murdy
et al. 1997, Robins and Ray 1999), counted, measured for total length (TL),
and weighed. Most were released alive, but voucher specimens for most species
were preserved using 10% formaldehyde.
In addition to sampling fishes, a conductivity-temperature-depth (CTD)
instrument (Seabird SBD 19 CTD profiler) was used at each site to obtain
a vertical profile of salinity and temperature, which was measured every
second as the CTD was lowered. Surface temperature, average survey depth,
minimum survey depth, and maximum survey depth were also recorded from
the data logger of the Albatross IV (Table 1). All measures of depth were
highly and positively correlated with one another (r > 0.90), and we therefore
used average survey depth because of data availability. Depth was not well
correlated with salinity or temperature (-0.15 < r < 0.08), and SAB habitats
2007 J.W. Love and P.D. Chase 707
Table 1. Environmental data collected in January (2005) for 14 tows of shelf and shelf-slope
habitats in the Northwestern Atlantic Ocean for the Mid-Atlantic Bight (MAB) and South Atlantic
Bight (SAB). Abbreviations are: LAT (latitude), SAL (average salinity, ppt), S_TEMP
(surface temperature, °C), B_TEMP (bottom temperature, °C), V_TEMP (average vertical temperature,
°C) and its standard deviation (SD), M_DEP (minimum depth, m), X_DEP (maximum
depth. m), and DEP (average depth, m). NA = Not Available.
TOW LAT SAL (SD) S_TEMP B_TEMP V_TEMP M_DEP X_DEP DEP
SAB
10-1 3319.84 35.89 (0.02) 20.94 21.02 21.01 (0.06) 26.6 31.1 29.4
11-1 3314.40 35.86 (0.05) 22.20 21.90 22.11 (0.14) NA NA 39.0
11-2 3314.81 35.86 (0.03) 23.01 22.08 22.70 (0.50) 39.0 42.3 39.0
13-1 3255.99 35.82 (0.01) 23.23 21.37 22.63 (0.57) 122.5 125.4 123.9
13-2 3257.31 35.68 (0.77) 23.23 20.99 22.60 (0.72) 110.3 123.6 117.6
13-3 3256.43 35.82 (0.01) 23.23 21.70 22.64 (0.54) 114.8 121.4 118.1
16-1 3256.58 35.79 (0.08) 18.66 17.29 17.85 (0.37) 29.5 31.6 30.5
16-2 3254.67 35.84 (0.06) 19.80 19.08 19.62 (0.39) 33.4 36.8 35.0
MAB
27-1 3636.74 33.35 (0.40) 17.12 11.56 10.31 (0.61) 95.2 97.4 96.3
27-2 3641.01 33.59 (0.10) 16.00 11.05 10.70 (0.24) 96.8 100.9 98.4
32-1 3638.26 32.86 (0.04) 8.90 8.72 8.64 (0.08) 30.1 37.0 33.3
32-2 3641.46 NA 8.97 NA NA 33.9 44.5 39.6
34-1 3815.99 32.59 (0.01) 8.53 8.30 8.29 (0.01) 66.7 68.6 67.7
34-2 3816.65 NA 8.48 NA NA 63.8 68.6 66.2
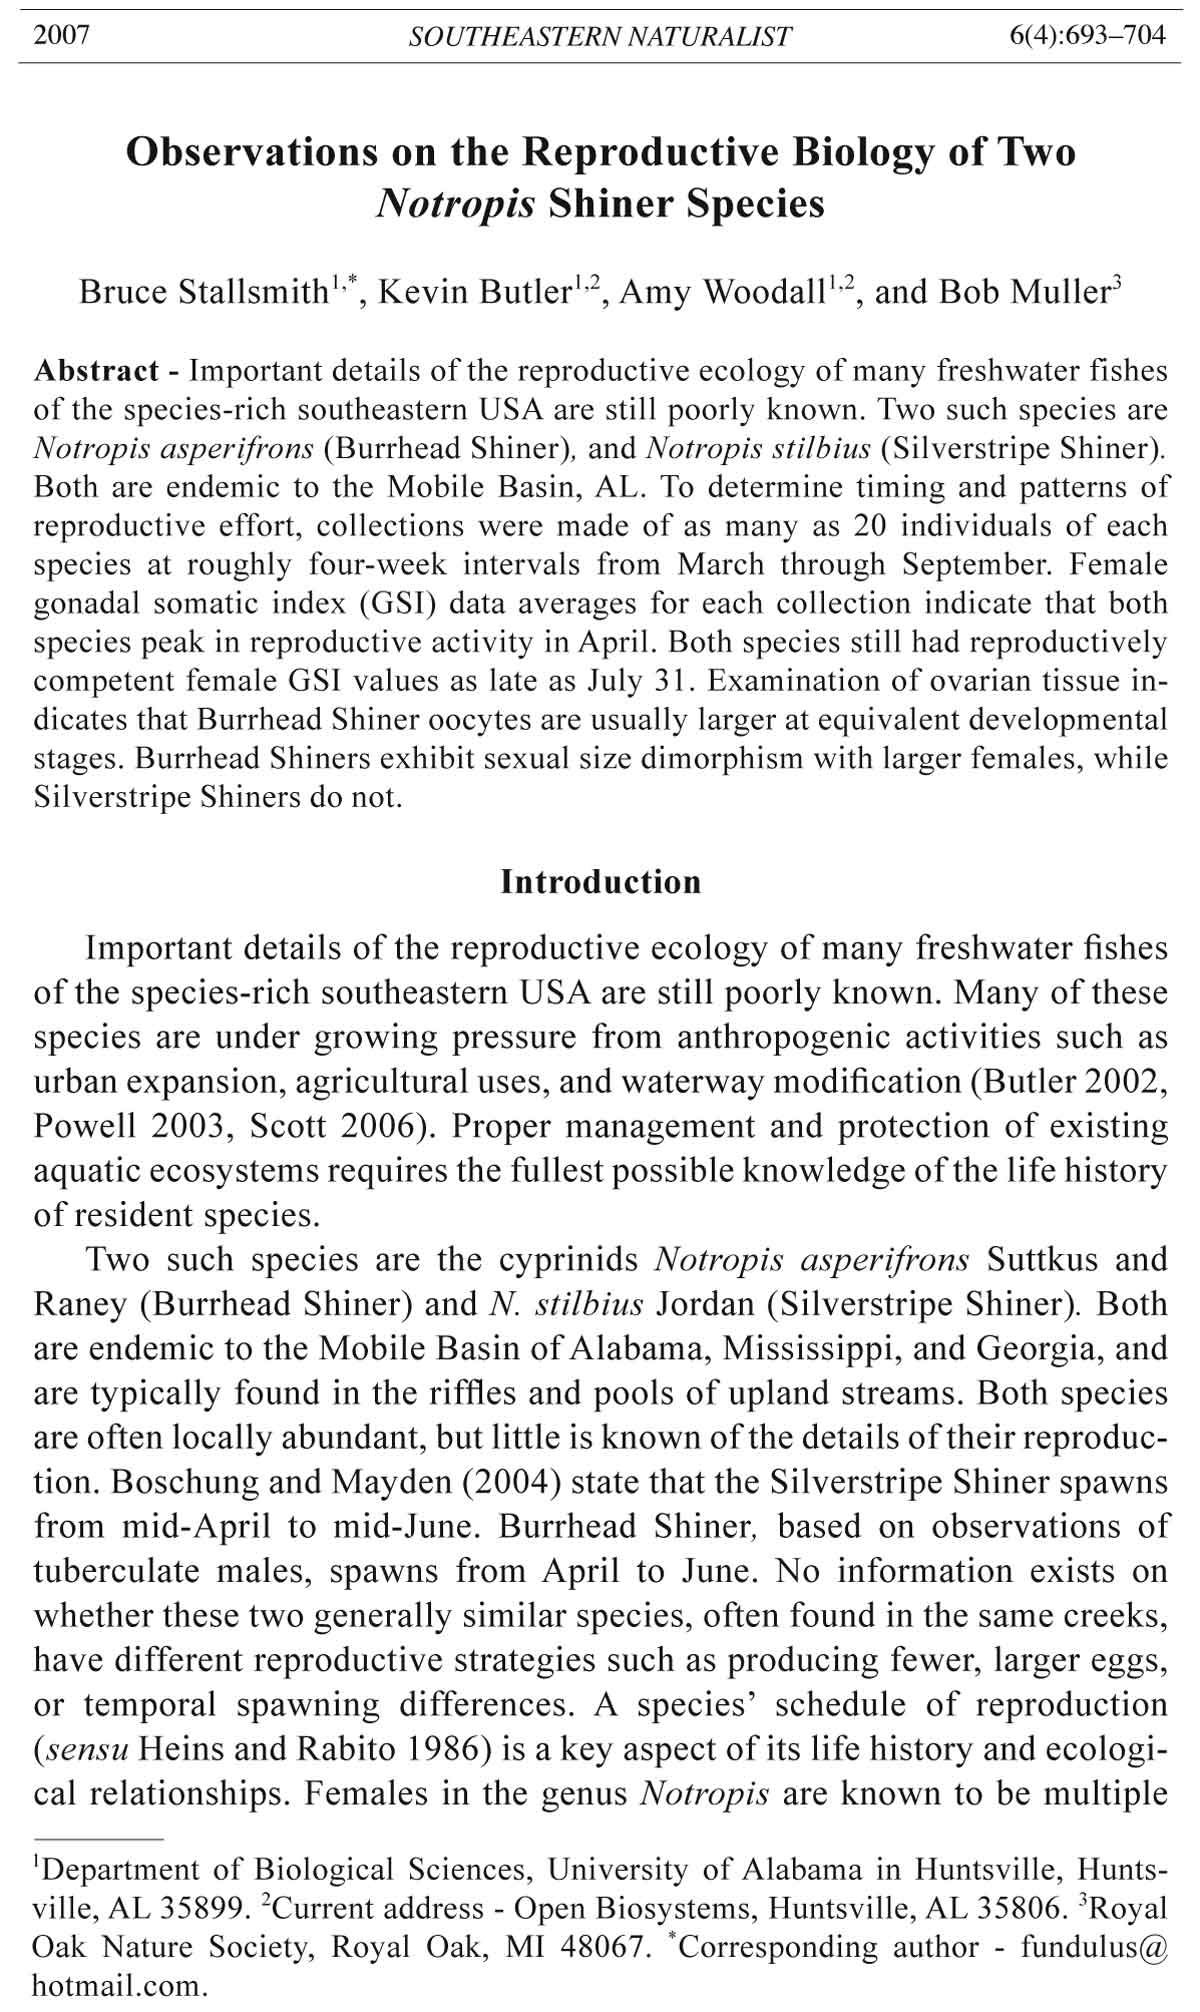
Figure 1. Map of
14 sites within
the Northwestern
Atlantic
Ocean during
January (2005).
For reference,
C h e s a p e a k e
Bay (CB) and
Cape Hatteras,
NC (CH) are labeled.
were warmer and saltier than MAB habitats. Surface, bottom, and average
vertical temperatures were highly correlated with one another (r > 0.93,
for all), and because of data availability, we used surface temperature as a
predictor in canonical correspondence analysis (CCA; ter Braak 1986).
708 Southeastern Naturalist Vol.6, No. 4
We used CCA to explore species’ distributions along environmental
gradients of average depth and surface-water temperature, which differed
by about 10 °C between SAB and MAB habitats (Table 1). Axes were
scaled to optimize the representation of species scores in ordination space,
and site scores were re-scaled with mean = 0 and variance = 1. Thus, the
distances among species scores best approximates the relationships among
each other and to the environmental predictors plotted in the ordination diagram
(McCune and Grace 2002). The eigenvalues for each axis were tested
for significance using a Monte Carlo permutation procedure that generated
a null distribution of eigenvalues by randomizing the relationship between
the species and environmental datasets for 1000 times. For CCA, we used
PC-ORD (McCune and Mefford 1999).
Results
We collected and identified 41 families represented by 68 species of fish,
7 of which were cartilaginous (Table 2). Fourteen abundant species (>1% of
catch) represented 89% of the total biomass (Table 3), which was 2664.53
kg. Squalus acanthias Linnaeus (Spiny Dogfish) was the most abundant
species (28.6% of sample). Many Spiny Dogfish were bearing and birthing
pups. Individuals ranged in size from 25 to 98 cm TL and 40 to 4200 g. Most
were adults with a mean size of 76 cm TL (± 7.4 SD) and mean mass of
Table 2. Fish families collected aboard the R/V Albatross IV by percent of catch (of 2742 fish)
during January 2005 from shelf and shelf-slope habitats of the Mid-Atlantic and South Atlantic
Bights. Numbers in parentheses are the number of identified species for each family.
Family % catch Family % catch
Acanthuridae (1) 0.11% Ophidiidae (2) 0.15%
Acropomatidae (1) 0.40% Ostraciidae (2) 1.35%
Balistidae (1) 0.84% Paralichthyidae (2) 1.20%
Batrachoididae (1) 0.04% Phycidae (2) 0.22%
Blenniidae (1) 0.04% Scorpaenidae (1) 0.07%
Bothidae (2) 0.22% Pomacanthidae (1) 0.69%
Carangidae (5) 0.40% Pomacentridae (1) 0.04%
Carcharhinidae (1) 0.15% Pomatomidae (1) 0.55%
Chaetodontidae (2) 1.06% Priacanthidae (2) 0.15%
Dasyatidae (1) 0.55% Rajidae (2) 0.80%
Fistulariidae (2) 0.22% Sciaenidae (1) 0.22%
Gobiesocidae (1) 0.04% Scombridae (1) 2.04%
Gymnuridae (1) 0.04% Serranidae (4) 1.53%
Haemulidae (3) 13.82% Sparidae (5) 28.08%
Holocentridae (1) 0.15% Squalidae (1) 28.56%
Labridae (1) 0.51% Stromateidae (1) 2.44%
Lutjanidae (1) 7.70% Synodontidae (3) 2.48%
Monacanthidae (3) 1.57% Tetraodontidae (1) 0.22%
Myliobatidae (1) 0.07% Triglidae (2) 1.17%
Ogcocephalidae (1) 0.04% Uranoscopidae (1) 0.04%
Ophichthidae (1) 0.04%
2007 J.W. Love and P.D. Chase 709
1700 g (± 653.1 SD). Only 2 of these individuals were under 30 cm TL and
may have been birthed in the trawl.
Cumulatively, 35% of the potential variance in the community data set
was explained by two axes, with the first axis explaining more (Eigenvalue
= 0.86, p = 0.001, % variance = 22.0) than the second (Eigenvalue = 0.49,
p = 0.001, % variance = 12.6). Because these two axes represented 1/3 of the
variance in the original data set, and to ease interpretations of the CCA, we
utilized only the first two axes for evaluating how species were associated
with environmental variables.
Temperature was highly correlated with axis 1 (r = 0.92) and depth
was highly correlated with axis 2 (r = -0.86). Correlations between species
scores and those scores constrained by environmental variables were
high (Axis 1: r = 0.98; p < 0.01; Axis 2: r = 0.95; p < 0.01). We interpreted
the CCA plot, which ordinated species’ scores based on predicted,
optimal abundances across habitat gradients of depth and temperature.
From this plot, we grouped four, distinct winter fish assemblages: 1)
shallow, warm-water (SAB) assemblages; 2) deep, warm-water (SAB)
assemblages; 3) shallow, cold-water (MAB) assemblages; and 4) deep,
cold-water (MAB) assemblages.
Assemblages differed markedly in composition and diversity between
colder water of the MAB and warmer water of the SAB. Species exclusive
to our samples from colder water of the MAB included: Spiny Dogfish, Raja
Table 3. Percentage of catch, average total length (TL) (± standard deviation), and average mass
per individual (± standard deviation) for fishes collected on R/V Albatross IV during January
2005 from shelf and shelf-slope habitats of the Mid-Atlantic and South Atlantic Bights. Species
listed are >1% of total catch and are given in descending order of % total catch.
Species % catch N TL (cm) Mass (g)
Spiny Dogfish 28.6% 291A 76.1 ± 7.4 1704.2 ± 653.1
Scup 18.3% 497 18.1 ± 2.3 103.2 ± 30.8
Tomtate, Haemulon aurolineatum Cuvier 13.4% 382 11.1 ± 4.4 28.4 ± 41.6
and Valenciennes
Vermillion Snapper, Rhomboplites 7.7% 211 23.5 ± 6.7 184.7 ± 111.6
aurorubens (Cuvier and Valenciennes)
Knobbed Porgy, Calamus nodosus 5.3% 144 30.9 ± 5.4 631.3 ± 315.7
Randall and Caldwell
Whitebone Porgy 2.8% 76 28.8 ± 3.1 534.1 ± 168.2
Butterfish 2.4% 67 15.0 ± 3.0 51.4 ± 35.9
Atlantic Mackerel 2.0% 56 29.4 ± 2.5 170.2 ± 44.3
Inshore Lizardfish, Synodus foetens (L.) 1.7% 46 17.2 ± 10.7 66.9 ± 5.9
Red Porgy, Pagrus pagrus (L.) 1.6% 44 30.8 ± 6.0 435.0 ± 237.1
Orange Filefish, Aluters schoepfi(Walbaum) 1.5% 40 39.4 ± 11.8 711.5 ± 357.1
Scrawled Cowfish, Acanthostracion 1.2% 34 29.1 ± 2.1 411.9 ± 84.6
quadricornis (L.)
Summer Flounder 1.1% 33 43.3 ± 9.1 918.9 ± 543.7
Northern Searobin 1.1% 31 23.9 ± 1.8 127.1 ± 31.6
AValue reflects a subsample (of 789) that was measured and weighed.
710 Southeastern Naturalist Vol.6, No. 4
eglanteria Bosc (Clearnose Skate), Leucoraja erinacea (Mitchill) (Little
Skate), Prionotus carolinus (Linnaeus) (Northern Searobin), Pomatomus
saltatrix (Linnaeus) (Bluefish), Scomber scombrus Linnaeus (Atlantic
Mackerel), Peprilus triacanthus (Peck) (Butterfish), Hippoglossina oblonga
(Mitchill) (American Fourspot Flounder), and Paralichthys dentatus (Linnaeus)
(Summer Flounder). In contrast, assemblages from warmer water
were more diverse (see list in Fig. 2) and consisted of many reef-associated
fish families (e.g., Chaetodontidae, Pomacanthidae, Balistidae) and porgies
(Sparidae), including Stenotomus chrysops (Linnaeus) (Scup), our second
most abundant species (Table 3).
Assemblages differed by depth, with a fairly distinct shallow, coldwater
assemblage (Fig. 2) that included benthopelagic Spiny Dogfish, other
pelagic species such as Peprilus triacanthus (Peck) (Butterfish), Atlantic
Mackerel, and 4 demersal species. In shallow, warm water, we collected
pelagic and reef-associated species that included: Diplectrum formosum
(Linnaeus) (Sand Perch), Hypsoblennius hentz (Lesueur) (Feather Blenny),
and Acanthostracion polygonius Poey (Honeycomb Cowfish). In deeper
water, we mainly collected reef-associated and demersal species that included:
Clearnose Skate, Ophichthus puncticeps (Kaup) (Palespotted Eel),
Scorpaena brasiliensis Cuvier (Barbfish), Centropristis striata (Linnaeus)
(Black Seabass), Synagrops bellus (Goode and Bean) (Blackmouth Bass),
and Summer Flounder.
Figure 2. Species associations when constrained by water temperature and depth
gradients for fish assemblages sampled in the northwestern Atlantic Ocean (January
2005), as inferred from canonical correspondence analysis. Different symbols
represent different assemblages: shallow, warm water (empty circle); deep, warm
water (empty diamond); shallow, cold water (filled circle); deep, cold water (filled
diamond). Species associated with each group are labeled near groups.
2007 J.W. Love and P.D. Chase 711
Discussion
We found more species and a different composition of fishes in the SAB
than the MAB during our winter survey. The latitudinal gradient of species
diversity is an extremely well-known ecological pattern (Rosenzweig 1995),
and our data reflect a pattern expected for fish and invertebrate communities
of the Atlantic Ocean (Floeter et al. 2004, MacPherson 2002, MacPherson
and Duarte 1994). Underlying processes explaining the patterns are less
understood. MacPherson (2002) suggested that patterns of sea-surface temperature
and nitrate load accounted for patterns of diversity for benthic and
pelagic communities, respectively. In the SAB, the circulation of the gulf
stream serves to warm continental-shelf and shelf-slope waters more than
continental-shelf waters of the MAB. Higher endogenous sources of energy
(i.e., more stable and high temperatures) may be associated with higher rates
of species diversification, thereby explaining higher diversity (Hunt et al.
2005, Kaspari et al. 2004, Wright 1983). The greater abundance of reefs,
or habitat complexity, may also explain greater species diversity (Floeter et
al. 2004). In addition, diversity may be explained by dispersal, disturbance,
and time since habitat isolation (Loreau and Mouquet 1999, Love and Taylor
2004, McCabe and Gotelli 2000), but such patterns depend on taxonomic,
temporal, and spatial scales (Lyons and Willig 2002, Willig et al. 2003). Our
survey was limited to marine fishes at 14 sites during one season of 2005,
and much remains to be learned about patterns of marine fish diversity as
they relate to depth, latitude, and their interaction.
Seasonal changes in marine fish assemblages are well-documented
(Desmond et al. 2002, Murphy and Secor 2006, Witting et al. 1999), and
several migratory species were collected north of Cape Hatteras (e.g., Spiny
Dogfish, Summer Flounder). The most abundant species encountered during
this study—Spiny Dogfish—occurred north of Cape Hatteras . This species
seasonally migrates south from Nova Scotia to Cape Hatteras as water temperatures
cool to 7.2–12.8 °C (ASMFC 2002), which overlaps the observed
water temperature during our collection. During winter, Spiny Dogfish typically
overwinters in deeper water (McMillan and Morse 1999), but we also
found notable biomass in shallow water (≈30 m). One interesting finding
was that females prematurely birthed in sorting bins while being measured
and weighed, which may be related to handling stress and have implications
on estimating by-catch mortality for this species. Other marine fishes that
inhabit waters less than 30 m in the MAB during summer (e.g., Summer
Flounder) also retreat during winter to deeper water, which may be a thermal
refugia due to the influence of the gulf stream. Bottom temperatures at
deeper areas (edge of the continental shelf) of the MAB were 3 °C warmer
than at shallower, shelf sites. Several benthic fishes, such as Lophius americanus
Valenciennes (Goosefish), were not collected, though they occurred
in the area (NOAA 2005), which likely was a result of gear bias. Our survey
of 2 northern latitude zones in January 2006 yielded similar species to those
collected in 2005, with the exceptional catch of a goosefish.
712 Southeastern Naturalist Vol.6, No. 4
Another interesting find in our study was the collection of Scup in the
SAB. Generally, Scup is regarded as rare in the SAB (Carpenter 2003),
but marine regions of MAB and SAB may be more connected by dispersal
than previously thought (Jones and Quattro 1999), leading to an exchange
of fauna. While Scup is replaced by S. caprinus Jordan and Gilbert (Longspine
Porgy) south of Cape Hatteras, we did not collect Longspine Porgy,
which is abundant south of the habitats we were surveying (Carpenter
2003). Recent investigations into morphological differences between
SAB and MAB populations of Scup have shown that northern populations
are typically larger, have higher scale counts, and slightly different body
shapes (J.W. Love, unpubl. data), but more comprehensive studies are underway.
While the taxonomy of southern and northern populations of Scup
is unclear (Johnson 1978, Robins et al. 1991), this uncertainty should not
have affected interpretations of our results.
Learning how, when, and why species are distributed in the manner that
they are is becoming increasingly valuable as the development of marine
protected areas (MPAs) becomes a viable and effective option for protecting
marine resources. Here, we publish a descriptive and exploratory
account of composition and diversity of winter fish assemblages in the
South and Mid-Atlantic Bights, but more work should be done to survey
both regions thoroughly. The widely accepted process of global climate
change (Oreskes 2004) deserves greater attention and has yet unappreciated
consequences on continental-shelf or shelf-slope ecosystems. As
temperatures within marine environments progressively change, primary
productivity may change and affect species distributions, thereby altering
the face of food-web dynamics and ecosystem function. While the influence
of climatic phenomenon on trophic interactions is not well-known, it
may have implications on ecosystem-based management for MPAs or other
coastal habitats (Preston 2004), especially if species’ distributions (and
thus, species’ interactions) are strongly affected by regional or global climatic
phenomena (e.g., Gulf Stream or North Atlantic Oscillation).
Acknowledgements
We would like to thank participating students and faculty of the NOAA Living
Marine Resources Cooperative Science Center for their work during collections of
species. Specifically, we thank Drs. Eric May and Andrea Johnson for their logistical
support and assistance with research activities. We thank NOAA for the opportunity
to work aboard the NOAA R/V Albatross IV. We also thank the sincere and helpful
editorial efforts of reviewers and, in particular, Dr. F. Rohde. Funding for this
research and the maintenance of voucher specimens was provided by NOAA (grant
#NA17AE1626) and USDA (grant #2005-03535).
Literature Cited
Atlantic States Marine Fisheries Commission (ASMFC). 2002. Interstate fishery
management plan for Spiny Dogfish. Fishery Management Report Number 40.
National Oceanic and Atmospheric Administration, Silver Springs, MD.
2007 J.W. Love and P.D. Chase 713
Carpenter, K.E. (Editor). 2003. FAO Identification Guide for Fishery Purposes. The
Living Marine Resources of the Western Central Atlantic, Volumes 2 and 3. Food
and Agriculture Organization of the United Nations, Rome, Italy.
Christensen, V., S. Guenette, J.J. Heymans, C.J. Walters, R. Watson, D. Zeller, and
D. Pauly. 2001. Estimating fish abundance of the North Atlantic, 1950 to 1999.
1–25, In S. Guenette, V. Christensen, and D. Pauly (Eds.). Fisheries Impacts on
North Atlantic Ecosystems: Models and Analyses. Fisheries Centre Research
Reports Volume 9. The Fisheries Centre, University of British Columbia, Vancouver,
B.C.
Desmond, J.S., D.H. Deutschman, and J.B. Zedler. 2002. Spatial and temporal variation
in estuarine fish and invertebrate assemblages: Analysis of an 11-year data
set. Estuaries 25:552–569.
Ferreira, C.E.L., J.E.A. Goncalves, and R. Coutinhow. 2001. Community structure of
fishes and habitat complexity in a tropical rocky shore. Environmental Biology
of Fishes 61:353–369.
Floeter, S.R., C.E.L. Ferreira, A. Dominici-Arosemena, and I.R. Zalmon. 2004. Latitudinal
gradients in Atlantic reef fish communities: Trophic structure and spatial
use patterns. Journal of Fish Biology 64:1680–1699.
Fogarty, M.J. 2004. Do marine protected areas really work? Oceanus 43:1–3.
Hoese, H.D., and R. Moore. 1998. Fishes of the Gulf of Mexico, 2nd Edition. Texas
A&M University Press, College Station, TX. 414 pp.
Hunt, G., T.M. Cronin, and K. Roy. 2005. Species-energy relationship in the deep
sea: A test using the Quatenary fossil record. Ecology Letters 8:739–747.
Johnson, G.D. 1978. Development of fishes of the Mid-Atlantic Bight IV. Carangidae
through Ephippidae. US Fish and Wildlife Service, Biological Services Program,
Washington, DC. FWS/OBS-78/12. 314 pp.
Jones, W.J., and J.M. Quattro. 1999. Genetic structure of Summer Flounder (Paralichthys
dentatus) populations north and south of Cape Hatteras. Marine Biology
133:129–135.
Kaspari, M., P.S. Ward, and M. Yuan. 2004. Energy gradients and the geographic
distribution of local ant diversity. Oecologia 140:407–413.
Kvitek, R.G., J.S. Oliver, A.R. de Gange, and B.S. Anderson. 1992. Changes in
Alaskan soft-bottom prey communities along a gradient in sea otter predation.
Ecology 73:413–428.
Loreau, M., and N. Mouquet. 1999. Immigration and the maintenance of local species
diversity. American Naturalist 154:427–440.
Love, J.W., and C.M. Taylor. 2004. Patterns of steam fish diversity across 5 drainages
in Mississippi. Southeastern Naturalist 3:637–644.
Lyons, S.K., and M.R. Willig. 2002. Species richness, latitude, and scale-sensitivity.
Ecology 83:47–58.
Macpherson, E. 2002. Large-scale species-richness gradients in the Atlantic Ocean.
Proceedings of the Royal Society of London, Series B. 269:1715–1720.
Macpherson, E., and C.M. Duarte. 1994. Patterns in species richness, size, and latitudinal
range of East Atlantic Fishes. Ecography 17:242-248.
McCabe, D.J., and N.J. Gotelli. 2000. Effects of disturbance frequency, intensity, and
area on assemblages of stream macroinvertebrates. Oecologia 124:270–279.
McCune, B., and M.J. Mefford. 1999. Multivariate analysis of ecological data, version
4.01. MjM Software, Glenden Beach, OR.
714 Southeastern Naturalist Vol.6, No. 4
McCune, B., and J.B. Grace. 2002. Analysis of Ecological Communities. MjM Software
Design, Glenden Beach, OR. 300 pp.
McMillan, D.G., and W.W. Morse. 1999. Spiny Dogfish, Squalus acanthias: Life
history and habitat characteristics. National Marine Fisheries Service, Northeast
Fisheries Science Center, Woods Hole, MA. 28 pp.
Meister, H.S., D.M. Wyanski, J.K. Loefer, S.W. Ross, A.M. Quattrini, and K.J. Sulak.
2005. Further evidence for the invasion and establishment of Pterois volitans (Teleostei:
Scorpaenidae) along the Atlantic Coast of the United States. Southeastern
Naturalist 4:193–206.
Murdy, E.O., R.S. Birdsong, and J.A. Musick. 1997. Fishes of Chesapeake Bay.
Smithsonian Institution Press, Washington, DC, and London, UK. 324 pp.
Murphy, R.F., and D.H. Secor. 2006. Fish and blue crab assemblage structure in a US
mid-Atlantic coastal lagoon complex. Estuaries and Coasts 29:1121–1131.
National Oceanographic and Atmospheric Association (NOAA). 2005. Resource
survey report: Bottom trawl survey (Cape Hatteras–SE Georges Bank). NOAA
Fisheries Service, Northeast Fisheries Science Center, Woods Hole, MA.
Oreskes, N. 2004. The scientific consensus on climate change. Science 306:1686.
Paine, R.T. 1966. Food-web complexity and species diversity. American Naturalist
100:65–75.
Paull, C.K., B. Hecker, R. Commeau, R.P. Freeman-Lynde, C. Neumann, W.P. Corso,
S. Golubic, J.E. Hook, E. Sikes, and J. Curray. 1984. Biological communities at
the Florida Escarpment resemble hydrothermal vent taxa. Science 226:965–967.
Pauly, D., V. Christensen, J. Dalsgaard, R. Froese, and F. Torres, Jr. 1998. Fishing
down marine food webs. Science 279:860–863.
Preston, B.L. 2004. Observed winter warming of the Chesapeake Bay estuary
(1949–2002): Implications for ecosystem management. Environmental Management
34:125–139.
Robins, C.R., and G.C. Ray. 1999. A Field Guide to Atlantic Coast Fishes: North
America (Peterson Field Guides). Houghton Mifflin Publishers, New York, NY.
354 pp.
Robins, C.R., R.M. Bailey, C.E. Bond, J.R. Brooker, E.A. Lachner, R.N. Lea, and
W.B. Scott. 1991. Common and scientific names of fishes from the United States
and Canada. American Fisheries Society Special Publication 20:1–183.
Rosenzweig, M.L. 1995. Species Diversity in Space and Time. Cambridge University
Press, New York, NY. 458 pp.
ter Braak, C.J.F. 1986. Canonical correspondence analysis: A new eigenvector technique
for multivariate direct gradient analysis. Ecology 67:1167–1179.
Willig, M.R., D.M. Kaufman, and R.D. Stevens. 2003. Latitudinal gradients of
biodiversity: Pattern, process, scale, and synthesis. Annual Review of Ecology,
Evolution, and Systematics 34:273–309.
Witting, D.A., K.W. Able, and M.P. Fahay. 1999. Larval fishes of a middle Atlantic
bight estuary: Assemblage structure and temporal stability. Canadian Journal of
Fisheries and Aquatic Sciences 56:222–230.
Wright, D.H. 1983 Species-energy theory: An extension of species-area theory.
Oikos 41:496–506.
Zabel, R.W., C.J. Harvey, S.L. Katz, T.P. Good, and P.S. Levin. 2003. Ecologically
sustainable yield. American Scientist 91:150–157.


 The Southeastern Naturalist is a peer-reviewed journal that covers all aspects of natural history within the southeastern United States. We welcome research articles, summary review papers, and observational notes.