Southeastern Naturalist
J.M. Hyde, P.M. Stewart, and J.M. Miller
2014 Vol. 13, No. 2
208
2014 SOUTHEASTERN NATURALIST 13(2):208–220
Species Richness Estimation and Rarefaction of Fish
Assemblages in a Small Watershed
J. Murray Hyde1, Paul M. Stewart1,*, and Jonathan M. Miller1
Abstract - Many investigators sample a site or watershed only once and use that sample to
characterize the location (e.g., indices of biotic integrity studies). Using real-world fish
assemblages, we investigated the adequacy of using a single sample, site, or season to characterize
the fish community at a site or watershed. We sampled twelve sites from the Little
Choctawhatchee River watershed (416 km2) by electrofishing six times at each location over
18 months (n = 72). We estimated species richness at each site during each season and for the
entire watershed using the Chao 2 estimator. We used these estimates to determine how many
samples at the local level and how many sites at the watershed level were needed. Additionally,
we determined the proportion of species found after 1–6 samples. Our results showed
that to observe 80–100% of species, 5.6–47.4 samples, respectively, were needed at the local
level over six seasons, 8.4–86.9 sites, respectively, were needed at the watershed level over a
single season, and 9–70 samples, respectively, were needed for the entire watershed over six
seasons. At the local level, we found a mean of 50–83% of the estimated species with 1–6
samples over six seasons. At the watershed level, we found a mean of 37% (SD = 3) with one
sample and 76% (SD = 6) after six samples over one season. Our results indicate that in general
a minimum of 5 samples is needed to detect at least 80% of the species present at the local
(site) level, and a minimum of 8 sites is needed in watersheds of approximately 400–450 km2.
Introduction
Species richness, or the number of species, is the most commonly used measure
of biodiversity (Kéry et al. 2009) and is a key factor in diversity studies (Chiarucci
et al. 2003). Species richness is useful in managing biodiversity (Boulinier et al.
1998), choosing areas for conservation (Melo and Froehlich 2001), and describing
communities (Foggo et al. 2003). However, a simple species count is often
not enough to make meaningful comparisons among sites. For all but the most
conspicuous taxonomic groups, a census of all species at a site is seldom practical
(Colwell and Coddington 1994). However, a one-time species count typically underestimates
the true species richness of a site (Hellman and Fowler 1999). Thus,
the number of samples needed to accurately characterize a site or watershed is an
important question when studying assemblages. Further, the cumulative number of
species usually increases with increasing sampling effort (Soberón and Llorente
1993). Thus, species richness at a site that has been sampled with greater effort
(multiple visits, double pass, etc.) cannot be directly compared to a site sampled
using less effort. This consideration is problematic because surveys are often performed
at different sampling intensities, making direct comparisons difficult or
1Department of Biological and Environmental Sciences, Troy University, Troy, AL 36082.
*Corresponding author - mstewart@troy.edu.
Manuscript Editor: Nathan Franssen
Southeastern Naturalist
209
J.M. Hyde, P.M. Stewart, and J.M. Miller
2014 Vol. 13, No. 2
biased. Seasonal sampling can also play a major role (Glowacki and Penczak 2005).
Depending on the taxon of interest, a given amount of effort applied during one
season may result in a species count different than one that is carried out with the
same effort but in another season (Soberón and Llorente 1993).
In studies that examine species richness, it is important to define the temporal
and spatial time frame of the study area in question. At a given point in time, a site
may not contain all the species in the colonizing pool due to factors such as seasonal
migration. Studies that take place over long periods during which populations are
open (influenced by births, deaths, immigration, and emigration) actually estimate
the colonizing pool over the duration of the study rather than the instantaneous species
richness of a site.
To compare sites sampled with varying levels of effort, species-richness data
must be standardized (Gotelli and Colwell 2001). A species-accumulation curve
is a graph of the cumulative number of species at a site versus a measure of effort
(e.g., person-hours, sampling occasions, length of reach, etc.; Colwell et al. 2004).
By comparing species-accumulation curves, rather than species counts, more meaningful
comparisons among sites or watersheds can be made. However, the shape of
a species accumulation curve is affected by the order in which samples are added
(Colwell and Coddington 1994, Moreno and Halffter 2000). Sampling error and
heterogeneity among samples can cause changes in the shape of the curve upon reordering
of samples (Colwell and Coddington 1994). To eliminate this bias, sample
order can be randomized repeatedly until a smoothed species accumulation curve
is obtained (Longino and Colwell 1997, Shiu and Lee 2003, Willot 2001). The
resulting rarefaction curve represents the mean number of species expected after x
number of samples or other measure of effort (Gotelli and Colwell 2001, Smith et
al. 1985).
Rarefaction curves are the smoothed versions of their corresponding speciesaccumulation
curves and are a form of interpolation (Colwell et al. 2004). However,
if the objective of a study is to measure species inventory completeness (e.g., 80%,
90%, etc.), an estimate of true species richness must first be obtained. One method of
estimating species richness is the use of nonparametric estimators (Wei et al. 2010),
which generally rely on the number of rare species to estimate species richness (Chao
et al. 2009). However, nonparametric estimators only estimate species richness.
They give no information regarding how many samples are needed to observe a given
proportion of the estimated species richness. A method developed by Colwell et al.
(2012) allows extrapolation of a rarefaction curve with 95% confidence intervals
beyond a reference sample (actual number of samples or individuals collected in a
study). This method uses an estimate of species richness as the asymptote approached
by the extrapolated curve. While any estimator may potentially be used, Colwell et
al. (2012) recommended and used the Chao 2 estimator because it is reasonably accurate
in many cases (Chao 1987). The curve to the left of the reference sample is
the interpolated rarefaction curve, and the curve to the right of the reference sample
is the extrapolated curve. Using this method Colwell et al. (2012) found the extrapolated
curve smoothly met the rarefaction curve at the reference sample for all data
Southeastern Naturalist
J.M. Hyde, P.M. Stewart, and J.M. Miller
2014 Vol. 13, No. 2
210
sets tested. These curves allow researchers to estimate the sampling effort required to
detect a target percentage of the estimated species present.
We sampled twelve sites in a small watershed during six seasons for a total of
six samples per site (n = 72). The objectives of this study were to (1) determine
the number of samples needed to observe 80%, 90%, 95%, and 100% of the estimated
colonizing pool at each site (local level) over six seasons; (2) determine the
number of samples needed to observe 80%, 90%, 95%, and 100% of the estimated
colonizing pool for each season in an entire watershed (watershed level); (3) determine
the number of samples needed to observe 80%, 90%, 95%, and 100% of
the colonizing pool for an entire watershed over six seasons; and (4) determine
what percentage of the estimated colonizing pool at each site/season was observed
after 1–6 samples.
Field-site Description
The Little Choctawhatchee River (LCR) originates near Dothan, AL, and flows
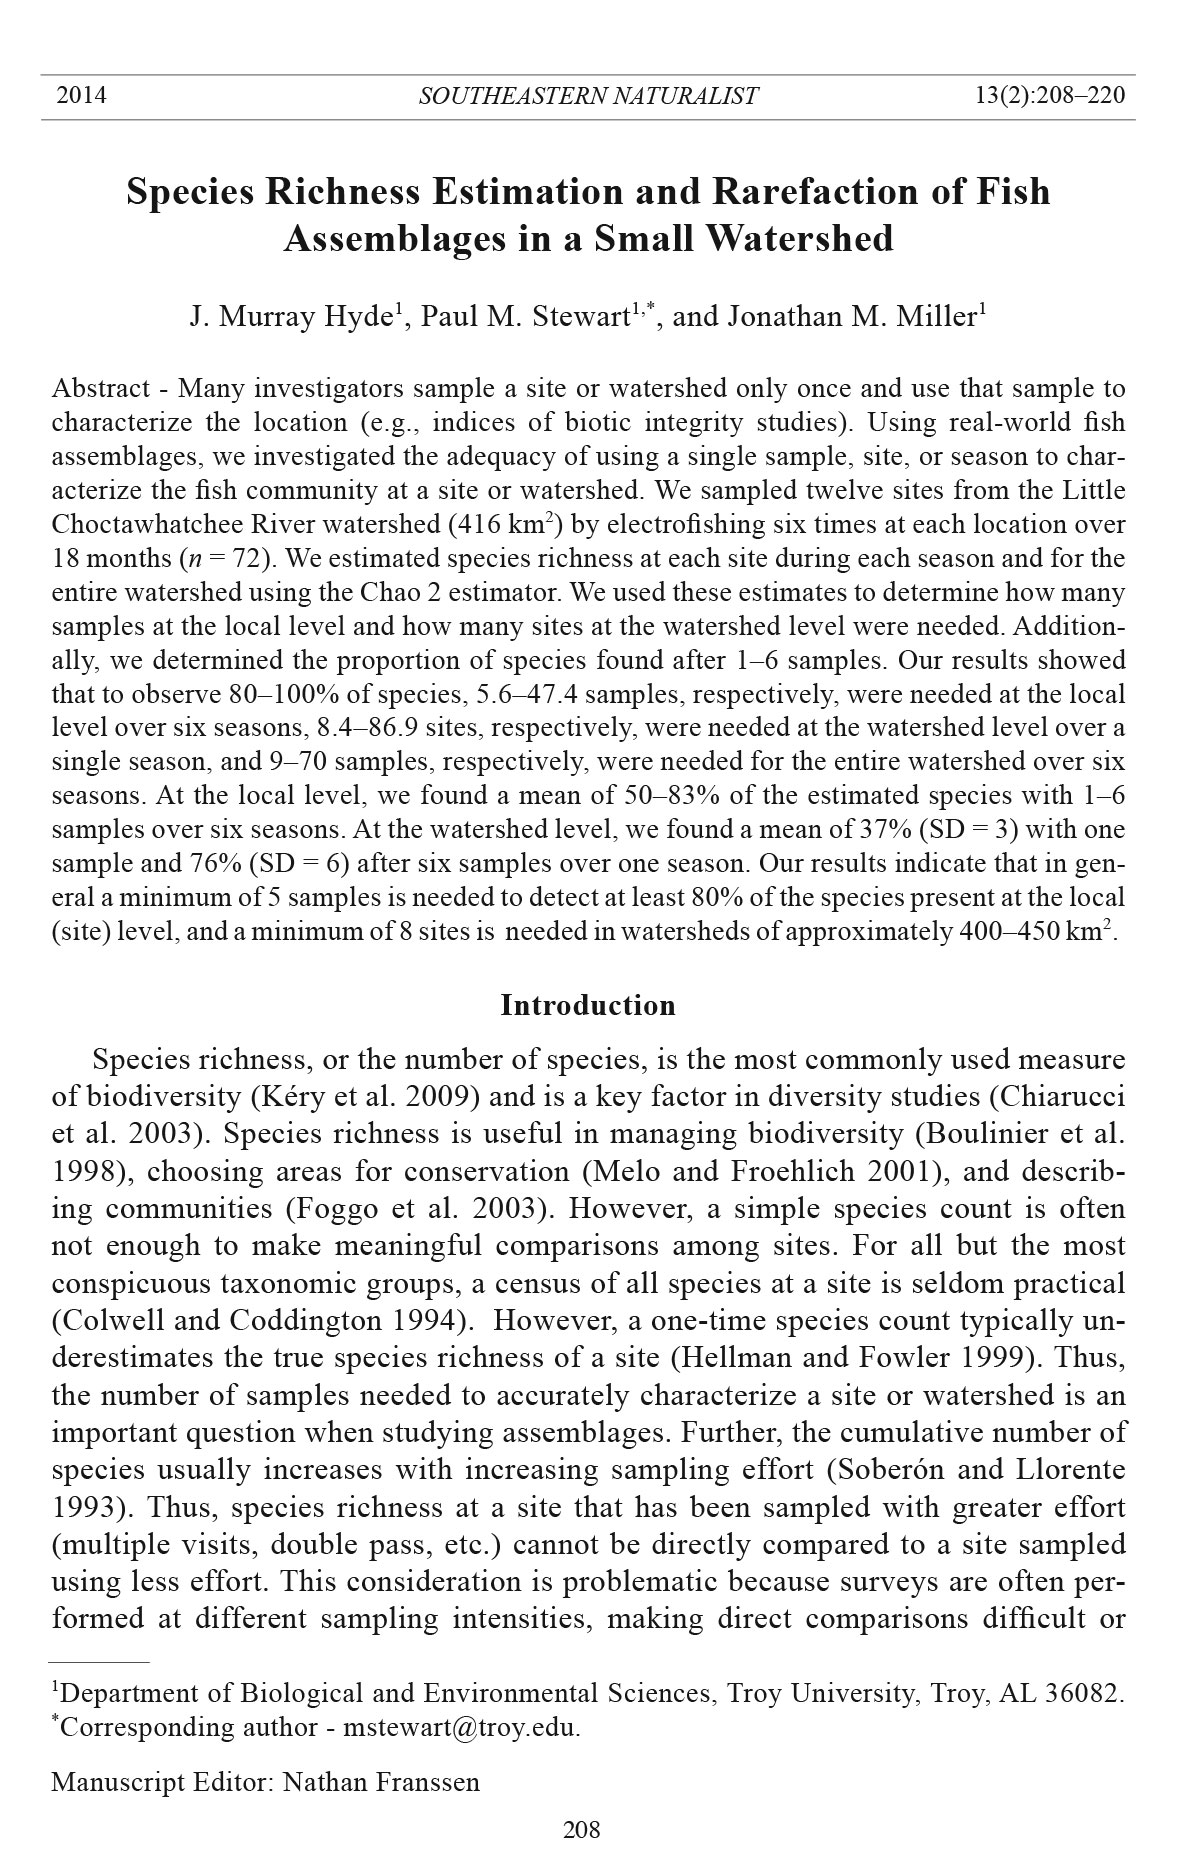
west until it joins the Choctawhatchee River about 5 km southeast of Daleville,
AL; including portions of Houston, Dale, and Geneva counties (Fig. 1). The LCR
is a fourth-order stream that drains 416 km2 and joins the Choctawhatchee River
approximately 11 km south of the confluence of the East and West forks of the
Choctawhatchee River. Across sites, river width varied from approximately 2–30
m, and reaches sampled ranged in size from 1st to 4th order.
Methods
Field methods
We conducted fish sampling at twelve sites in the LCR watershed at about threemonth
intervals, from December 2006 to June 2008, for a total of six samples at
each site (see Miller and Stewart [2013] for further site information, species list,
and abundance). Sampling roughly coincided with the following seasons, during
each of which all sites were sampled: winter 2006, summer 2007, fall 2007, winter
2007, spring 2008, and summer 2008. We sampled wadeable sites with a Smith-
Root Model 12-B® Battery Powered Backpack Electrofisher using a single pass,
and sites 6, 8, and 10, which were channelized near bridges, and site 7 (Fig. 1),
which was >1 m deep, with a boat-mounted Smith-Root Gas Powered Pulsator 2.5®
Portable Electrofisher. Sampling for all available habitats, including habitats beneath
bridges, began immediately downstream of the bridge crossing. The lengths
of our sample reaches were about 35 times the mean stream-width, but ≥150 m and
≤300 m (modified from Morris et al. 2007). We sampled the same reach at each site
on all sampling occasions.
Fishes were identified to species using standard taxonomic literature (Boschung
and Mayden 2004, Mettee et al. 1996). The voucher collection was confirmed by
a professional taxonomist (Patrick O’Neil, Geological Surbey of Alabama, Tuscaloosa,
AL) and archived in the aquatic laboratory at Troy University, Troy, AL.
Southeastern Naturalist
211
J.M. Hyde, P.M. Stewart, and J.M. Miller
2014 Vol. 13, No. 2
Data analysis
Sample-based rarefaction curves were created with EstimateS 9.0 (Colwell 2013)
using equation 17 of Colwell et al. (2012). We calculated rarefaction curves for each
site at the local level using sampling occasions (seasons) as a measure of effort (reference
sample = 6), and at the watershed level using the number of sites as a measure of
sampling effort (reference sample = 12). Additionally, all data was combined to construct
a single rarefaction curve treating each site (12) and sampling event (6) combination
as a single sample for a total of 72 samples for the entire watershed (reference
sample = 72).
We extrapolated rarefaction curves for each site at the local level to 24 samples,
and for each season at the watershed level to 48 sites using equation 18 of Colwell
et al. (2012), but did not extrapolate the rarefaction curve for the combined data
because it approached an asymptote well before the reference sample of 72 was
reached. In all cases, Chao 2 was used to find the estimated true species richness
of the colonizing pools used for extrapolation. We scaled rarefaction curves using
number of individuals as a measure of sampling effort to account for differences in
abundance at each site/season (Gotelli and Colwell 2001).
The proportion of species sampled after 1–6 samples at each site and during each
season was calculated by dividing the number of species found after each successive
sample by the estimate of the colonizing pool at each site and during each season.
We used equation 20 of Colwell et al. (2012) to determine the estimated number of
Figure 1. Twelve stream-sampling sites for fish on the Little Choctawhatchee River and
tributaries near the City of Dothan in southeastern Alabama, December 2006–June 2008.
Southeastern Naturalist
J.M. Hyde, P.M. Stewart, and J.M. Miller
2014 Vol. 13, No. 2
212
samples needed to observe 80%, 90%, 95%, and 100% of the estimated colonizing
pool for each site over six seasons, each season for the entire watershed, and the entire
watershed over six seasons. Because the equation is not valid when the proportion
of species equals one, we used 0.9999 as a close approximation of the number
of samples needed to observe 100% of species.
Results
The cumulative number of species observed at each site after six sampling occasions
ranged from 23 to 41 with a mean of 31.8 (SD = 5.3). An estimated mean
of 5.6–47.4 samples were necessary to observe 80–100%, respectively, of the
estimated colonizing pool at each site over six seasons (Table 1). We detected a
mean of 50–83% of the colonizing pool after 1–6 samples, respectively (Table 2).
Rarefaction curves of sites that had overall low abundance tended to reach an
Table 1. Cumulative species observed (Sobs), estimated colonizing pool (Sest), and number of samples
of fish needed to observe 80%, 90%, 95%, and 100% of the estimated colonizing pool at each site over
six seasons (December 2006–June 2008) and during each season over all sites. Site 3 was excluded
due to an unrealistically high species-richness estimate.
Percentage
80% 90% 95% 100% Sobs Sest
Site
Site 1 4.4A 7.4 10.3 36.6 35 40.6
Site 2 4.8A 7.7 10.6 36.9 32 37.6
Site 3 - - - - 34 109.8
Site 4 7.4 12.9 18.5 68.1 36 47.3
Site 5 1.5A 2.9A 4.4A 17.6 23 23.6
Site 6 15.8 24.9 33.9 114.6 28 48.8
Site 7 3.1A 4.8A 6.5 21.8 41 43.7
Site 8 8.9 15.0 21.2 76.0 36 49.9
Site 9 7.1 11.3 15.5 53.5 27 35.4
Site 10 4.3A 7.4 10.5 38.3 34 39.3
Site 11 3.1A 6.9 10.7 44.8 25 28.3
Site 12 1.8A 2.8A 3.8A 12.8 30 30.3
Mean 5.6 9.5 13.3 47.4 31.8 38.6C
SD 4.1 6.4 8.7 29.8 5.3 8.7C
Season
Winter 2006 6.7B 12.2 17.6 66.2 43 47.9
Summer 2007 5.5B 11.2B 16.9 67.8 45 49.5
Fall 2007 6.1B 10.2B 14.4 51.6 40 43.2
Winter 2007 5.5B 9.7B 13.8 51.0 44 47.2
Spring 2008 12.7 24.5 36.3 141.9 47 59.4
Summer 2008 13.6 25.4 37.1 142.8 44 56.4
Mean 8.4 15.5 22.7 86.9 43.8 50.6
SD 3.7 7.3 11.0 43.5 2.3 6.1
AGiven proportion of species was observed with 6 samples.
BGiven proportion of species observed with 12 sites.
CSite 3 excluded from mean and SD.
Southeastern Naturalist
213
J.M. Hyde, P.M. Stewart, and J.M. Miller
2014 Vol. 13, No. 2
asymptote much slower than sites where a larger number of individuals were detected
with each sample (Fig. 2). This pattern was especially true of Site 3 and, to
a lesser extent, Sites 6 and 8.
The cumulative number of species observed per season in the entire watershed
ranged from 40 (fall 2007) to 47 (spring 2008), with a mean of 43.8 (SD = 2.3).
An estimated mean of 8.4–86.9 samples (sites) were necessary to detect 80–100%,
respectively, of the estimated colonizing pool for a single season in the entire watershed
(Table 1). We detected a mean of 37–76% of the colonizing pool with 1–6
samples, respectively (Table 2). Rarefaction curves for spring and summer of 2008
suggested that sampling detected a much lower proportion of species during these
seasons (Fig. 3). A wider 95% confidence interval for these seasons also suggested
variability in estimates of species richness for these seasons.
Table 2. Proportion of estimated colonizing pool of fish observed after 1–6 samples at each site over
six seasons (December 2006–June 2008) and during each season over all sites. Site 3 was excluded
due to an unrealistically high species-richness estimate.
Sample
1 2 3 4 5 6
Site
Site 1 0.48 0.63 0.72 0.78 0.82 0.86
Site 2 0.48 0.61 0.70 0.76 0.81 0.85
Site 3 - - - - - -
Site 4 0.45 0.58 0.65 0.69 0.73 0.76
Site 5 0.69 0.84 0.90 0.94 0.96 0.98
Site 6 0.31 0.41 0.46 0.50 0.54 0.57
Site 7 0.51 0.69 0.79 0.86 0.91 0.94
Site 8 0.40 0.53 0.60 0.65 0.69 0.72
Site 9 0.43 0.54 0.61 0.67 0.72 0.76
Site 10 0.51 0.66 0.73 0.79 0.83 0.86
Site 11 0.56 0.71 0.79 0.83 0.86 0.88
Site 12 0.66 0.84 0.91 0.96 0.98 0.99
Mean 0.50 0.64 0.72 0.77 0.80 0.83
SD 0.11 0.13 0.13 0.13 0.13 0.12
Season
Winter 2006 0.38 0.55 0.64 0.70 0.74 0.78
Summer 2007 0.36 0.54 0.65 0.72 0.76 0.80
Fall 2007 0.38 0.55 0.65 0.72 0.77 0.80
Winter 2007 0.40 0.57 0.67 0.73 0.78 0.81
Spring 2008 0.36 0.50 0.58 0.63 0.66 0.69
Summer 2008 0.31 0.46 0.55 0.61 0.65 0.68
Mean 0.37 0.53 0.62 0.68 0.73 0.76
SD 0.03 0.04 0.05 0.05 0.06 0.06
Figure 2 (following page). Rarefaction curves with 95% confidence intervals (dotted
lines) for fish at 12 sites over six seasons (December 2006–June 2008) in the Little Choctawhatchee
River watershed. Lower x-axis is scaled by cumulative number of individuals.
Upper x-axis is scaled by number of samples. Filled circle represents reference sample.
Curve to the right of the reference sample is extrapolated.
Southeastern Naturalist
J.M. Hyde, P.M. Stewart, and J.M. Miller
2014 Vol. 13, No. 2
214
Southeastern Naturalist
215
J.M. Hyde, P.M. Stewart, and J.M. Miller
2014 Vol. 13, No. 2
The cumulative number of species observed for the entire watershed over six
seasons was 51. The total number of samples (sites) needed to observe 80%, 90%,
95%, and 100% of the colonizing pool for the entire watershed over six seasons was
9, 18, 29, and 70, respectively. The number of species detected was only 36% of the
estimated colonizing pool after one sample and only 75% even after six samples.
We did not extrapolate the rarefaction curve for the watershed because it reached a
clear asymptote well before the 72nd sample (Fig. 4).
Discussion
We sampled fishes at 12 sites in the LCR watershed over six seasons. Our
results suggest that six samples per site were usually sufficient to observe about
80% of the estimated colonizing pool over the duration of the study. We estimated
that more than six samples per site were necessary to observe 90%, 95%,
and 100% of the colonizing pool. At the watershed level, 12 sites were usually
enough to observe 80% of the estimated colonizing pool during each season.
Only in the spring and summer of 2008 were more than 12 samples needed. To
Figure 3. Rarefaction curves with 95% confidence intervals for six seasons (December
2006–June 2008) in the Little Choctawhatchee River watershed. Lower x-axis is scaled by
cumulative number of individuals. Upper x-axis is scaled by number of samples. Filled circle
represents reference sample. Curve to the right of the refe rence sample is extrapolated.
Southeastern Naturalist
J.M. Hyde, P.M. Stewart, and J.M. Miller
2014 Vol. 13, No. 2
216
observe 90% of the colonizing pool, more than 12 samples were needed in three
seasons. To observe 95% and 100% of the colonizing pool, 12 samples were
never sufficient (Table 1).
Our calculations indicated that a mean of 8.4, 15.5, 22.7, and 86.9 sites were
needed to observe 80%, 90%, 95%, and 100%, respectively, of the estimated species
in the watershed during each season. In a watershed sampled by Smith and
Jones (2005), which was comparable in size (432.8 km2) and observed species (55)
to the LCR watershed, it was necessary to sample 9, 17, 30, and 151 stream reaches
(sites), respectively, to observe the same percentage of species as in the current
study. These estimates also generally agreed with the 9, 18, 29, and 70 samples
needed to observe the estimated colonizing pool of the entire watershed over all six
seasons in the current study, despite the fact that the Smith and Jones (2005) study
took place over only one season.
Fishes were sampled previously one time at six sites in the LCR watershed, and
a total of 30 species was found (T.P. Simon, Indiana Biological Survey, Bloomington,
IN, unpubl. data). Our study found a total of 51 species in the watershed over
six seasons. However, we found a mean of 38.2 species during each season after
sampling only six sites (Fig. 3). For the entire watershed over six seasons, we found
38.1 species after six samples (Fig. 4). Differences in observed species richness
may be due to site, season, or sampling variability. However, the number of species
observed by Simon after six sites is substantially lower than the number observed
over our entire study.
Figure 4. Sample-based rarefaction curve with 95% confidence intervals for fish during
six seasons (December 2006–June 2008) in the Little Choctawhatchee River watershed.
Each site (12) and sampling event (6) combination was used as a sample for a total of 72
for the watershed.
Southeastern Naturalist
217
J.M. Hyde, P.M. Stewart, and J.M. Miller
2014 Vol. 13, No. 2
The Chao 2 estimator uses the number of uniques (species that occur in only one
sample) and duplicates (species that occur in exactly two samples) to estimate species
richness. When there is a large proportion of uniques and duplicates, the Chao 2
estimator gives a conservative estimate of species richness (Chao 1987). Likewise,
our estimates of the number of samples or sites necessary to observe 80–90% of the
colonizing pool at the local and watershed levels are also conservative estimates in
most cases. If the true species richness is higher, then the effort needed to observe
80–90% of species may also be higher.
While the Chao 2 estimator gives a lower-bound estimate when there is a large
proportion of uniques and duplicates, there are cases where species richness is overestimated.
After six seasons, Site 3 had a high number of uniques (14) and was the
only site to have no duplicates. This resulted in an unrealistically high estimate of
species richness (109.8). If even one of the unique species had been found on a second
occasion, the estimate would have been substantially reduced (66.5). Although
less exaggerated, Sites 6 (48.8) and 8 (49.9) had similar rarefaction curves (Fig. 2).
Both sites had a higher number of uniques and a much lower number of duplicates
(although not zero). The high ratio of uniques to duplicates at these sites may have
been a consequence of the overall lower abundance found at these sites. The Chao
2 estimator may overestimate species richness of fish assemblages when the number
of uniques is substantially higher than the number of duplicates, whether due to
under-sampling or sampling variability. Likewise, the resulting rarefaction curve
and estimate of number of samples needed to observe a given percentage may be
overestimated. Consequently, we excluded Site 3 from analysis, although we included
Sites 6 and 8.
The accuracy of our estimates of the sampling effort needed to observe a given
percentage of species is dependent, in this case, on the accuracy of the Chao 2 estimator.
The Chao 2 estimator has been widely used to estimate species richness for
a variety of taxa and has been shown to be reasonably accurate in many cases with
a high proportion of rare species (Chazdon et al. 1998, Melo and Froehlich 2001,
Walther and Martin 2001, Walther and Morand 1998), although few studies have
examined its use on fish assemblages. Thus, we believe the Chao 2 estimator is a
reasonable choice until further studies comparing nonparametric species richness
estimators are concluded.
Many studies attempt to characterize a site or watershed using one or a limited
number of samples or sites, for instance, indices of biotic integrity and
calculations of diversity indices (Morris et al. 2007, Wang et al. 2001). Our study
suggests that, at the local level, a single sample detects a mean of only 50% of the
potential species at a site. A single sample from a small watershed is less accurate,
detecting only 37% of the species present over a single season and 36% of species
over multiple seasons.
Although the species composition of fish assemblages is likely to vary among
watersheds, the amount of sampling needed to observe a targeted percentage of
species is likely somewhat consistent in similar-sized watersheds. This consistency
would be especially likely in watersheds within the same ecoregion, such as the
Southeastern Naturalist
J.M. Hyde, P.M. Stewart, and J.M. Miller
2014 Vol. 13, No. 2
218
southeastern Coastal Plains. Sampling effort may even be consistent in watersheds
from different ecoregions, although data to make this comparison are limited
(Smith and Jones 2005). At the local (site) level, a mean of 5.6 samples were needed
to detect 80% of the estimated colonizing pool, and five samples were sufficient
to detect 80% of the colonizing pool at seven sites. Therefore, when the primary
objective is determining a site’s species richness, we recommend a minimum of five
samples. This number allows detection of a relatively high proportion of the fish assemblage
without an inordinate amount of effort; it also satisfies Chao’s minimum
recommendation of five samples needed to estimate species richness (Chao 1987).
At sites where overall abundance of fishes was low, such as our sites 3, 6, and 8, five
samples may be insufficient. Sampling at such sites should continue until the extrapolated
curve reaches a clear asymptote. The number of sites needed to achieve
a given target percentage in a watershed is dependent on the size of the watershed.
We recommend a minimum of eight sample sites in watersheds of comparable size
to the LCR watershed (416 km2), which was sufficient to detect 80% of the colonizing
pool during six seasons. Future studies should focus on confirming the sampling
effort necessary to adequately characterize watersheds of various sizes in the southeastern
Coastal Plains and other ecoregions, as well as determining the accuracy of
the Chao 2 estimator when used on fish assemblages.
Literature Cited
Boschung, H.T., and R.L. Mayden. 2004. Fishes of Alabama. Smithsonian Books, Washington,
DC. 736 pp.
Boulinier, T., J.D. Nichols, J.R. Sauer, J.E. Hines, and K.H. Pollock. 1998. Estimating
species richness: The importance of heterogeneity in species detectability. Ecology
79:1018–1028.
Chao, A. 1987. Estimating the population size for capture–recapture data with unequal
catchability. Biometrics 43:783–791.
Chao, A., R.K. Colwell, C. Lin, and N.J. Gotelli. 2009. Sufficient sampling for asymptotic
minimum species-richness estimators. Ecology 90:1125–1133.
Chazdon, R.L., R.K. Colwell, J.S. Denslow, and M.R. Guariguata. 1998. Statistical methods
for estimating species richness of woody regeneration in primary and secondary
rain forests of northeastern Costa Rica. Pp. 285–309, In F. Dallmeier and J.A. Comiskey
(Eds.). Forest Biodiversity Research, Monitoring and Modeling. Smithsonian Institution,
Washington, DC.
Chiarucci, A., N.J. Enright, G.L.W. Perry, B.P. Miller, and B.B. Lamont. 2003. Performance
of nonparametric species-richness estimators in a high-diversity plant community. Diversity
and Distributions 9:283–295.
Colwell, R.K. 2013. EstimateS: Statistical estimation of species richness and shared species
from samples. Version 9. User’s Guide and application available online at http://purl.
oclc.org/estimates. Accessed 12 April 2013.
Colwell, R.K., and J.A. Coddington. 1994. Estimating terrestrial biodiversity through extrapolation.
Philosophical Transactions of the Royal Society of London B 345:101–118.
Colwell, R.K., C.X. Mao, and J. Chang. 2004. Interpolating, extrapolating, and comparing
incidence-based species accumulation curves. Ecology 85:2717–27 27.
Southeastern Naturalist
219
J.M. Hyde, P.M. Stewart, and J.M. Miller
2014 Vol. 13, No. 2
Colwell, R.K., A. Chao, N.J. Gotelli, S.-Y. Lin, C.X. Mao, R.L. Chazdon, and J.T. Longino.
2012. Models and estimators linking individual-based and sample-based rarefaction,
extrapolation, and comparison of assemblages. Journal of Plant Ecology 5(1):3–21.
Foggo, A., M.J. Attrill, M.T. Frost, and A.A. Rowden. 2003. Estimating marine species
richness: An evaluation of six extrapolative techniques. Marine Ecology Progress Series
248:15–16.
Glowacki, L., and T. Penczak. 2005. Species-richness estimators applied to fish in a small
tropical river sampled by conventional methods and rotenone. Aquatic Living Resources
18:159–168.
Gotelli, N.J., and R.K. Colwell. 2001. Quantifying biodiversity: Procedures and pitfalls in
the measurement and comparison of species richness. Ecology Let ters 4:379–391.
Hellman, J.J., and G.W. Fowler. 1999. Bias, precision, and accuracy of four measures of
species richness. Ecological Applications 9:824–834.
Kéry, M., A. Royle, M. Plattner, and R.M. Dorazio. 2009. Species richness and occupancy
estimation in communities subject to temporary emigration. Ecol ogy 90:1279–1290.
Longino, J.T., and R.K. Colwell. 1997. Biodiversity assessment using structured inventory:
Capturing the ant fauna of a tropical rain forest. Ecological Applications 7:1263–1277.
Melo, A.S., and C.G. Froehlich. 2001. Evaluation of methods for estimating macroinvertebrate
species richness using individual stones in tropical streams. Freshwater Biology
46:711–721.
Mettee, M.F., P.E. O'Neil, and J.M. Pierson. 1996. Fishes of Alabama and the Mobile Basin.
Oxmore House, Inc., Birmingham, AL. 820 pp.
Miller, J.M., and P.M. Stewart. 2013. Historical vs. current biological assemblages in the
Little Choctawhatchee Watershed, southeastern AL, USA. Southeastern Naturalist
12(2):267–282.
Moreno, C.E., and G. Halffter. 2000. Assessing the completeness of bat biodiversity inventories
using species accumulation curves. Journal of Applied Ecology 37:149–158.
Morris, C.C., P.M. Stewart, and T.P. Simon. 2007. Development of an index of biotic integrity
for a southeastern coastal plain watershed, USA. Journal of the American Water
Resources Association 43:1–13.
Shiu, H.J., and P.F. Lee. 2003. Assessing avian point-count duration and sample size using
species-accumulation functions. Zoological Studies 42:357–367.
Smith, E.P., P.M. Stewart, and J. Cairns, Jr. 1985. Similarities between rarefaction methods.
Hydrobiologia 120:167–170.
Smith, K.L., and M.L. Jones. 2005. Watershed-level sampling-effort requirements for determining
riverine fish species composition. Canadian Journal of Fisheries and Aquatic
Sciences 62:1580–1588.
Soberón, J., and J. Llorente. 1993. The use of species accumulation functions for the prediction
of species richness. Conservation Biology 7:480–488.
Walther, B.A., and J.-L. Martin. 2001. Species richness estimation of bird communities:
How to control for sampling effort. Ibis 143:413–419.
Walther, B.A., and S. Morand 1998. Comparative performance of species richness estimation
methods. Parasitology 116:395–405.
Wang, L., J. Lyons, P. Kanehl, and R. Bannerman. 2001. Impacts of urbanization on
stream habitat and fish across multiple spatial scales. Environmental Management
28(2):255–266.
Southeastern Naturalist
J.M. Hyde, P.M. Stewart, and J.M. Miller
2014 Vol. 13, No. 2
220
Wei, S., L. Li, B.A. Walther, W. Ye, Z. Huang, H. Cao, J.-Y. Lian. Z.-G. Wang, and Y. Chen.
2010. Comparative performance of species-richness estimators using data from a subtropical
forest community. Ecological Research 25:93–101.
Willot, S.J. 2001. Species-accumulation curves and the measure of sampling effort. Journal
of Applied Ecology 38:484–486.


 The Southeastern Naturalist is a peer-reviewed journal that covers all aspects of natural history within the southeastern United States. We welcome research articles, summary review papers, and observational notes.