Assessment of Wildlife Habitat Attributes at Restoration Projects on Northern Wisconsin Lakeshores
Daniel E. Haskell, Christopher R. Webster, Alex L. Bales, Michael W. Meyer,
and David J. Flaspholer
Northeastern Naturalist, Volume 24, Issue 4 (2017): 391–412
Full-text pdf (Accessible only to subscribers. To subscribe click here.)
Access Journal Content
Open access browsing of table of contents and abstract pages. Full text pdfs available for download for subscribers.
Current Issue: Vol. 30 (3)

Check out NENA's latest Monograph:
Monograph 22


Northeastern Naturalist Vol. 24, No. 4
D.E. Haskell1, C.R. Webster, A.L. Bales, M.W. Meyer, and D.J. Flaspholer
2017
391
2017 NORTHEASTERN NATURALIST 24(4):391–412
Assessment of Wildlife Habitat Attributes at Restoration
Projects on Northern Wisconsin Lakeshores
Daniel E. Haskell1,*, Christopher R. Webster1, Alex L. Bales1, Michael W. Meyer2,
and David J. Flaspholer1
Abstract - Housing development along lakeshores typically results in the loss of native
shoreline vegetation, which can negatively impact habitat structure and associated
wildlife populations. We evaluated vegetation restoration efforts on 2 lakeshores in Vilas
County, WI, and contrasted them with undeveloped reference lakeshores. The primary
goal of the restoration activities was to restore native understory vegetation and habitat
structure. Initial measurements made at reference lakeshores showed greater visual
obstruction density, greater sapling and shrub densities, greater abundance of downed
woody material, and higher canopy coverage relative to initial measurements made at
developed lakeshore sites. Three years post-restoration we observed significant increases
in visual obstruction density and increased shrub and sapling density at restoration sites.
While restoration of complex understory habitats is a slow and uncertain process, a nonmetric
multi-dimensional scaling ordination of wildlife habitat attributes suggested that
restoration sites are on a developmental trajectory that should increase their similarity
to reference sites with time. Further monitoring and adaptive management will likely be
needed to ensure restoration goals are met.
Introduction
Freshwater ecosystems have attracted human development for centuries
(Naiman 1996, Rierra et al. 2001). The Midwest region of the US experienced a
146% increase in housing development from 1940 to 2000 with one of the highest
relative growth rates occurring in northern Wisconsin (Radeloff et al. 2005), which
contains one the highest densities of freshwater glacial lakes in the world. Since
1965, the number of new houses built along Wisconsin lakeshores has increased by
over 200% (Radeloff et al. 2001, WDNR 1996). Gonzalez-Abraham et al. (2007)
suggest that lakes are the single most important factor determining both housing
density and spatial patterns of housing development throughout this region.
Lakeshores provide critical habitat for a variety of wildlife (Engel and Pederson
1998). Increased light and water availability often results in vegetation
communities that are more species-diverse and structurally complex along lakeshore
forest edges relative to interior forests (Elias and Meyer 2003, Harper
and MacDonald 2001, Kaufmann et al. 2014a, Whittier et al. 2002). Nevertheless,
across North America high concentrations of housing development along
1Ecosystem Science Center, School of Forest Resources and Environmental Science, Michigan
Technological University, 1400 Townsend Drive, Houghton, MI 49931. 2Wisconsin Department
of Natural Resources, 107 Sutliff Avenue, Rhinelander, WI 54501. *Corresponding
author - dehaskel@mtu.edu.
Manuscript Editor: David Halliwell
Northeastern Naturalist
392
D.E. Haskell1, C.R. Webster, A.L. Bales, M.W. Meyer, and D.J. Flaspholer
2017 Vol. 24, No. 4
lakeshores and associated removal of native vegetation (Christensen et al. 1996,
Elias and Meyer 2003, Haskell 2009, Kaufmann et al. 2014a, Marburg et al. 2006,
Whittier et al. 2002) has been shown to fragment wildlife habitat (Theobald et
al. 1997), alter habitat use and movement patterns, and reduce local biodiversity
(Czech et al. 2000, Wilcove et al. 1998).
Removal of native vegetation can alter the physical characteristics of lakes
and the biological processes that occur near and within them. For instance, highly
developed lakeshores have been shown to contain lesser amounts of coarse woody
debris (Christensen et al. 1996, Whittier et al. 2002) and aquatic vegetation in the
littoral zone (Kaufmann et al. 2014b, Radomski and Goeman 2001, Whittier et
al. 2002), thereby reducing habitat for waterfowl and fish (Jennings et al. 1999,
Moyle and Hotchkiss 1945) and decreasing fish growth rates and abundance (Sass
et al. 2006, Schindler et al. 2000). Furthermore, Lindsay et al. (2002) reported
altered foraging guilds of breeding birds along lakeshores with a high degree of
housing development in the upper Midwest. Similarly, Kaufmann et al. (2014b)
reported lower percentage of native neo-tropical bird on lakes in the Northeast
corresponding with increases in road density and near-shore human disturbance.
Housing density has also been negatively associated with Lithobates clamitans
melanota (Rafinesque) (Northern Green Frog) abundance (Woodford and Meyer
2003) and carnivore species richness and diversity in northern Wisconsin (Haskell
et al. 2013). In central Ontario, housing development on lakeshores has resulted in
altered behavior and diet of Neovison vison (Schreber) (American Mink; Racey and
Euler 1983a) and reduced diversity and abundance of small mammals (Racey and
Euler 1982). Piscivorous birds such as Gavia immer (Brunnich) (Common Loon.)
and Pandion haliaetus L. (Osprey) have been shown to avoid lakes with a high level
of human disturbance (Newbrey et al. 2005).
Many studies have cited habitat structure as the most influential ecological
factor determining patterns of habitat occupancy by wildlife (Anderson
and Shugart 1974, Blanchette et al. 2007, Buskirk and Powell 1994, DeGraaf
and Yamaski 2003, Mooty et al. 1987, Morrison et al. 1998). If vegetation is
tall and layered (stratified), it can support a more diverse and rich suite of biota
(Hunter and Schmiegelow 2011, MacArthur and MacArthur 1961). Saplings and
shrubs are a critical component of the understory habitat in lake riparian areas
(Clark et al. 1984, Elias and Meyer 2003, Kaufmann et al. 2014a, Racey and Euler
1983b, Robertson and Flood 1980) because they provide vertical structure and
food sources for a variety of birds and mammals (Ehrlich et al. 1988, Goodrum
et al. 1971, Martin et al. 1961). For example, non-game bird species use saplings
and shrubs for nesting and foraging (DeGraaf and Yamaski 2003). This shrubby,
sapling layer also provides habitat and food for Bonasa umbellus (L.) (Ruffed
Grouse; Blanchette et al. 2007), Meleagris gallopavo L. (Wild Turkey; Dickson
1992), and Odocoileus virginianus (Zimmermann) (White-tailed Deer; Mooty et
al. 1987). In addition, sapling and shrubs provide shoreline stability, with saplings
eventually recruiting into the overstory. Standing dead trees and logs are additional
habitat components relatively scarce along developed lakeshores (Christensen
Northeastern Naturalist Vol. 24, No. 4
D.E. Haskell1, C.R. Webster, A.L. Bales, M.W. Meyer, and D.J. Flaspholer
2017
393
et al. 1996, Schindler et al. 2000). Standing dead and downed woody material
are important to the function and structure of healthy terrestrial and aquatic ecosystems
(Harmon et al. 1986, McComb 2016) and also provide habitat for a wide
variety of wildlife species (Gilbert et al. 1997, Jaeger 1990, Maser et al. 1979,
Rusch et al. 2000, Tallmon and Mills 1994).
Interest in lakeshore restoration has grown due to a greater awareness of the vulnerability
and importance of lakeshore ecosystems. Lakeshores denuded of native
vegetation are increasingly viewed as unnatural and aesthetically unappealing by
lake residents and the public at large (Engel and Pederson 1998, Macbeth 1992).
Restoration on human altered lakeshores can remedy habitat simplication of biotic
habitat (Lorenz et al. 2017). In this paper, we present data on lakeshore habitat structure,
vegetation density, and composition before and after understory restoration of
shrubs and saplings intended to improve wildlife habitat. We compare these restored
plots to unrestored control plots on developed lakeshores and undeveloped reference
lakeshores over a 3-year period. We predicted that changes in habitat structure and
vegetation composition would change at restored lakeshores more dramatically than
control lakeshores. We also predicted that measurements made at restored lakeshores
after restoration would trend towards those made at reference lakeshores.
Methods
Study area
This project was conducted in the Northern Highlands Ecological Landscape on
2 lakeshores in a forested landscape on deep sands with pitted glacial outwash in
Vilas County, WI (Thwaites 1929; Fig. 1). Vilas County encompasses a 2636-km2
area along the state’s northern border with the Upper Peninsula of Michigan. Glacial
lakes cover ~16% of the county’s area (WDNR 2005), and 53% of the area is
in private ownership (Schnaiberg et al. 2002). The land cover is a mixture of bogs,
Figure 1. The Northern Highlands Ecological Landscape (http://dnr.wi.gov/topic/landscapes/
index.asp?mode=detail&Landscape=12) showing the location of restoration
sites (Found and Little St. Germain Lakes) and reference sites (Star and Escanaba Lakes)
within Vilas County, WI.
Northeastern Naturalist
394
D.E. Haskell1, C.R. Webster, A.L. Bales, M.W. Meyer, and D.J. Flaspholer
2017 Vol. 24, No. 4
northern wet forest, boreal forest, and northern dry to xeric forest (Curtis 1959).
The daily mean ambient temperature is 3.4 °C annually, varying from -2º C in January
to 10º C in July, and the mean annual precipitation is 80.25 cm (WDNR 2014a).
The soils on these lakeshores are sandy with low nutrient values (see Table 1 for
soil characteristics on each site; NRCS 1986, WDNR 2014a).
We conducted wildlife habitat restoration projects on 2 high-development
lakeshores: Found Lake (45°57'20.71"N, 89°26'58.08"W; housing density = 21
homes per linear km of lakeshore) and Little Saint Germain Lake (45°55'15.49"N,
89°27'23.64"W; housing density = 25 homes per linear km of lakeshore). We established
control sites (properties that did not receive restoration) on the same 2
lakes where habitat restoration occurred. Additionally, we established unrestored
reference sites on 2 nearby lakeshores (Star and Escanaba Lakes; Fig. 1) that contain
low levels of housing development (less than 10 houses per linear km of lakeshore;
Marburg et al. 2006), which allowed us to gauge the success of our restoration
efforts (Hobbs and Harris 2001, SER 2004). We selected reference lakeshore sites
that were matched with Found and Little Saint Germain Lakes sites to have similar
morphological characteristics, such as surface area, substrate, and lake type (Morrison
2002, SER 2004).
Installation of restoration projects
From 2007 to 2012, we planted a variety of tree saplings and shrubs within the
state-mandated lakeshore vegetated buffer zone that is 10.8 m wide from the original
high water mark (WDNR 2014b). A total of 334 tree saplings from 17 species
and 1415 shrubs from 28 species were planted within the buffer zone along ~500 m
of linear lakeshore on 13 private properties on Found Lake from 2007 to 2008
(Table 2). From 2011 to 2012, a total of 221 trees saplings from 18 species and 587
shrubs from 28 species were planted along ~300 m of linear lakeshore on 6 privately
owned Little Saint Germain Lake properties (Table 2). Restoration plans were
designed by Vilas County Land and Water Conservation Department personnel.
Table 1. Mean soil and site characteristics of 4 lakeshores in Vilas County, WI. Soil samples were collected
at each site prior to restoration activities and analyzed for percent nitrogen (N), phosphorus (P),
and potassium (K) at the Soil and Plant Analysis Lab at the University of Wisconsin-Madison. Aspect
is direction of plot in degrees facing lake.
Houses
Surface Lake per %
area perimeter km of organic P K Soil Aspect Slope
Lake (ha) (m) shoreline Treatment pH matter % N (ppm) (ppm) texture (°) (°)
Escanaba 132 8135 0.56 Reference 4.8 6.5 0.16 12 46 Sand 174 18
Found 119 6362 21.06 Control 5.0 4.6 0.18 11 58 Loamy 163 20
sand
Restored 5.3 3.0 0.08 10 45 Sand 196 14
Star 488 19,124 3.92 Reference 4.4 10.1 0.27 10 63 Sand 292 18
LSG 397 17,856 25.50 Control 4.9 4.0 0.15 23 106 Sand 249 16
Restored 4.5 5.1 0.23 16 80 Sand 244 25
Northeastern Naturalist Vol. 24, No. 4
D.E. Haskell1, C.R. Webster, A.L. Bales, M.W. Meyer, and D.J. Flaspholer
2017
395
Table 2. Species of trees and shrubs restored on 2 lakeshores in Vilas County, WI.
% of species
planted per lake
Little St.
Species Common name Found Germain
Trees Abies balsamea (L.) Mill. Balsam Fir 0.036 0.113
Acer rubrum L. Red Maple 0.040 0.090
Betula papyrifera Marshall Paper Birch 0.114 0.140
Ostrya virginiana (Mill.) K. Koch Ironwood 0.009 0.023
Picea glauca (Moench) Voss White Spruce 0.087 0.113
Picea mariana (Mill.) Britton, Sterns, Black Spruce 0.000 0.009
& Poggenb.
Pinus resinosa Aiton Red Pine 0.060 0.072
Pinus strobus L. E. White Pine 0.150 0.136
Populus balsamifera L. Balsam Poplar 0.012 0.000
Populus tremuloides Michx. Quaking Aspen 0.027 0.018
Prunus Americana Marshall American Plum 0.054 0.009
Prunus pensylvanica L. f. Pin Cherry 0.069 0.045
Prunus serotine Ehrh. Black Cherry 0.009 0.009
Prunus virginiana L. Chokecherry 0.060 0.023
Quercus bicolor Willd. Swamp White Oak 0.012 0.000
Quercus macrocarpa Michx. Bur Oak 0.012 0.000
Quercus rubra L. Northern Red Oak 0.108 0.090
Sorbus Americana Marshall American Mt. Ash 0.069 0.054
Thuja occidentalis L. Northern White Cedar 0.066 0.027
Tsuga canadensis (L.) Carrière Eastern Hemlock 0.003 0.027
Shrubs Amelanchier canadensis (L.) Medik. Canada Serviceberry 0.018 0.034
Amelanchier laevis Wiegand Allegheny Serviceberry 0.007 0.015
Arctostaphylos uva-ursi (L.) Spreng. Bearberry 0.083 0.077
Aronia melanocarpa (Michx.) Elliott Glossy Black Chokeberry 0.089 0.068
Comptonia peregrine (L.) J.M. Coult. Sweetfern 0.071 0.094
Cornus alternifolia L.f. Pagoda Dogwood 0.005 0.015
Cornus racemosa Lam. Grey Dogwood 0.034 0.000
Cornus rugosa Lam. Roundleaf Dogwood 0.000 0.034
Cornus sericea L. Redosier Dogwood 0.035 0.034
Corylus americana Walter American Hazelnut 0.033 0.068
Corylus cornuta Marshall Beaked Hazelnut 0.030 0.187
Diervilla lonicera Mill. Low-bush Honeysuckle 0.139 0.085
Ilex verticillata (L.) A. Gray Winterberry 0.002 0.012
Myrica gale L. Sweet Gale 0.029 0.000
Physocarpus opulifolius (L.) Maxim. Common Ninebark 0.044 0.043
Rhus hirta L. Staghorn Sumac 0.029 0.000
Rosa blanda Aiton Wild Rose 0.000 0.003
Rosa carolina L. Carolina Rose 0.011 0.000
Rosa palustris Marshall Swamp Rose 0.016 0.009
Sambucus nigra L. American Elder 0.027 0.000
Spiraea alba Du Roi Meadowsweet 0.067 0.017
Symphoricarpos albus (L.) S.F. Blake Common Snowberry 0.140 0.051
Vaccinium angustifolium Aiton Low-bush Blueberry 0.059 0.126
Viburnum lentago L. Nannyberry 0.022 0.003
Viburnum opulus L. var. americanum Aiton High-bush Cranberry 0.008 0.000
Viburnum rafinesqueanum Schult. Downy Arrowwood 0.001 0.024
Northeastern Naturalist
396
D.E. Haskell1, C.R. Webster, A.L. Bales, M.W. Meyer, and D.J. Flaspholer
2017 Vol. 24, No. 4
Tree saplings and shrubs were delivered from a local private nursery and varied in
height from 152.0 to 183.0 cm and 30.5 to 61.0 cm, respectively. Tree saplings and
shrubs were planted at densities of 1 sapling and 3 shrubs per 9.29 m2 (100 ft2), as
prescribed by the “Wisconsin Biology Technical Note 1: Shoreland Restoration”
(NRCS 2002). We selected native tree and shrub species based on their presence at
low-developed lakeshores (D.E. Haskell, unpubl. data) in the Northern Highlands
Ecological Landscape and expert advice from local botanists and private nursery
personnel that specialize in lakeshore restoration. All planting activities were performed
by field staff from Michigan Technological University and the Vilas County
Land and Water Conservation Department.
We established aboveground sprinkler irrigation systems on the restoration
sites, providing ~2.5 cm of water per week for the first year from late May to
mid-September. Lake water was supplied to each sprinkler by electric pumps. To
promote downward root growth, irrigation was slowly reduced in the years following
restoration activities. To deter herbivory by White-tailed Deer, we installed a
2.4-m–tall fencing around the entire perimeter of each restoration site.
Habitat sampling
We divided each shoreline reach designated for restoration (developed with
restoration), control (developed without restoration), and reference (undeveloped)
into 50-m segments, respectively, using GIS software. These segments were then
subdivided into five 10 m x 10 m plots. We randomly selected 1 plot from each
segment for monitoring (restoration n = 16, control n = 12, reference n = 15). We divided
each plot into four 5 m × 5 m subplots and randomly chose 2 subplots within
each 10 m × 10 m plot in which to tally by species all live saplings and shrubs ≥30
cm in height but ≤5 cm diameter breast height (dbh).
Because the vertical distribution of vegetation density plays a central role in
habitat selection and how habitat is used by a wide range of avian and mammalian
species (Morrison 2002), we measured the vertical distribution of vegetation using
a 0.5 m × 3.0 m density board (checkerboard) with 10 cm × 10 cm grid squares to
measure percent visual obstruction density at 4 different height categories (0.0–
0.3 m, >0.3–1.0 m, >1.0–2.0 m, >2.0–3.0 m). Squares at least 50% obstructed by
green vegetation were counted and converted to a relative index of percent cover
(Bibby et al. 1992). We place the visual obstruction density board 1.0 m, 5.0 m, and
9.0 m inland from the shoreline at the edge of each 10 m × 10 m plot. Each measurement
was taken from 10 m away with the observer and density board positioned
perpendicular to the shoreline. In order to evaluate canopy cover, we used a digital
hemispherical photograph taken at 0.5 and 1.5 m above the ground and centered
in each plot. We used image analysis software (WinScanopy 2005) to estimate the
fraction of total pixels in each photo classified as open sky (gap fraction = number
of pixels classified as sky ÷ total number of pixels). We tallied coarse woody debris
within each 10 m × 10 m plot, grouped into 3 classes: logs, snags (standing dead
trees), and stumps. We defined logs as downed woody segments ≥10 cm in diameter
and ≥150 cm in length, snags as standing dead trees ≥10 cm at dbh and ≥1.37 m tall,
and stumps as standing dead trees ≥10 cm diameter but less than 1.37 m tall (Marburg et al.
Northeastern Naturalist Vol. 24, No. 4
D.E. Haskell1, C.R. Webster, A.L. Bales, M.W. Meyer, and D.J. Flaspholer
2017
397
2006). We collected the above data (sapling and shrub density, visual obstruction
density, gap fraction, and course woody debris) at all sites prior to the initiation of
restoration efforts at Found and Little Saint Germain Lakes, and then remeasured
all sites 3 years post treatment. Found and Escanaba Lakes were sampled in 2007
and 2010. Little Saint Germain and Star Lakes were sampled in 2011 and 2014.
Data analysis
We used 2-way ANOVA models to test whether changes in total sapling density
(saplings per ha), total shrub density (shrubs per ha), gap fraction at 0.5 and 1.5 m
height, visual obstruction density at each of 4 height categories, and coarse woody
debris between pre-restoration surveys and surveys taken 3 years after restoration
varied between control, treated, and/or reference plots. Model effects for all
response variables included “Treatment” (control, restored, and reference plots),
“Survey Number” (survey 1 and survey 2 refer to pre-restoration and 3 years postrestoration,
respectively), and “Treatment × Survey Number” interaction. A significant
interaction indicates that changes in the response variable between survey
years varied among control, restored, and/or reference plots. We also included
“Lake” in the model as a fixed-effect nested within “Treatment” in order to account
for variation between lakes. We nested the effect because some treatments
only occur at some of the 4 lakes (e.g., the reference plots are only at Escanaba
and Star Lakes). When an interaction was significant, we used Tukey’s honest significant
difference (HSD) to test for statistical differences between survey years
for each treatment. We conducted analyses with JMP version 11.2.0 (SAS Institute,
Inc. 2013).
To simultaneously examine the composition of habitat features through time
across treatments, we used nonmetric multi-dimensional scaling ordination as
implemented in PC ORD auto-pilot mode using the “slow and thorough” setting
(McCune and Grace 2002), which employs Sorenson’s distance and a random
starting configuration. Habitat features were relativized by column maximum to a
common scale for analysis. We chose this approach because wildlife often respond
to a suite of habitat features rather than a single metric (Morrison et al. 1998) and it
allows for the visualization of changes in the composition of these features among
treatments. Site/treatment locations in the ordination space indicate dissimilarity,
with points further apart being more compositionally dissimilar. Arrows show the
movement of each site/treatment through time. The beginning and end of each arrow
represents the average location in the ordination space of plots associated with
each treatment.
Results
Visual obstruction data
Restoration plots (treated) had a significantly greater increase in visual obstruction
density at 0.0 m to 0.3 m height between pre- and post-restoration surveys
relative to control and reference plots (interaction effect: F2, 79 = 3.24, P = 0.044;
Fig. 2A). Tukey’s HSD tests indicate that only treated plots showed significant
Northeastern Naturalist
398
D.E. Haskell1, C.R. Webster, A.L. Bales, M.W. Meyer, and D.J. Flaspholer
2017 Vol. 24, No. 4
increases in visual obstruction between surveys (Fig. 2A). Similarly, at >0.3 to
1.0 m height, the interaction of Treatment × Survey Number is marginally significant
(F2, 79 = 2.53, P = 0.086), with the treated plots experiencing a greater increase
in visual obstruction between pre- and post-restoration surveys relative to control
and reference plots (Fig. 2B). At >1.0 to 2.0 m height, visual obstruction varied
between treatment groups on the first survey with the reference sites having more
visual obstruction (Treatment main effect: F2, 79 = 13.95, P < 0.001; Fig. 2C), and
visual obstruction increased for all plots between surveys (Survey Number effect:
F1, 79 = 24.84, P < 0.001; Fig. 2C). Similarly, at >2.0 to 3.0 m height, visual obstruction
varied between treatment groups on the first survey with the reference sites
having more visual obstruction (Treatment main effect: F2, 79 = 7.91, P = 0.001;
Fig. 2D), and visual obstruction generally increased for all plots between surveys
(Survey Number effect: F1, 79 = 25.58, P < 0.001; Fig. 2D).
Total sapling and shrub density
Treated plots experienced increased shrub density between survey years, while
reference and control plots showed little change and slightly decreased, respectively
(interaction effect: F2, 79 = 24.62, P < 0.001; Fig. 3A). Treated plots also appeared to
Figure 2. Percent visual obstruction density coverage (mean ± 1 SE) by treatment measured
within the (A) 0.0–0.3 m, (B) 0.3–1.0 m, (C) 1.0–2.0 m, and (D) 2.0-3.0 m height classes
before (Survey 1) and 3 years after (Survey 2) restoration occurred at the treated sites. Treatments
having any letter in common (A, B, and/or C) are not statistically different from one
another (P > 0.05) based on Tukey’s honest significant difference (HSD) tests (Tukey’s test
used only when interaction effect was significant).
Northeastern Naturalist Vol. 24, No. 4
D.E. Haskell1, C.R. Webster, A.L. Bales, M.W. Meyer, and D.J. Flaspholer
2017
399
experience a greater increase in sapling density relative to control and reference plots
between survey years, but the effects were not statistically significant (interaction
effect: F2, 79 = 0.17, P = 0.843; Fig. 3B). However, shrub density varied significantly
Figure 3. Density (mean ± 1 SE) per ha of (A) shrubs and (B) saplings by treatment type
before (Survey 1) and 3 years after (Survey 2) restoration occurred at the treated sites. Treatments
having any letter in common (A, B, and/or C) are not statistically different from one
another (P > 0.05) based on Tukey’s honest significant difference (HSD) tests (Tukey’s test
used only when interaction effect was significant).
Northeastern Naturalist
400
D.E. Haskell1, C.R. Webster, A.L. Bales, M.W. Meyer, and D.J. Flaspholer
2017 Vol. 24, No. 4
between lakes (F3, 79 = 3.16, P = 0.029). Shrub density at our restored sites following
restoration was far greater than that of reference sites (Fig. 3A).
Coarse woody debris
The number of logs (Treatment effect: F2, 79 = 5.87, P = 0.004) and snags
(Treatment effect: F2, 79 = 9.92, P < 0.001) present in each plot differed significantly
between plot treatments, with reference plots generally having more logs and
snags than control and treated plots on average (Fig. 4A, B). There was no significant
influence of Treatment or Survey Number on the number of stumps counted
per plot (Fig. 4C). When all 3 coarse woody debris classes were taken as a whole,
only Treatment had a significant influence (Treatment effect: F2, 79 = 3.81, P =
0.026), with reference plots having more total coarse woody debris than control
and treated plots overall. Changes in coarse woody debris between surveys did not
vary among treatment types for any of the 3 coarse woody debris classes (interaction
effects not significant).
Canopy gap fraction
Canopy gap fraction at 0.5 m height varied significantly among treatment
types (Treatment effect: F2, 79 = 25.03, P < 0.001), with the reference plots having
considerably lower gap fraction (higher canopy coverage; Fig. 5A). Gap fraction
varied significantly between lakes (F2, 79 = 2.96, P = 0.037). At 1.5 m height,
change in gap fraction between survey years was dependent on treatment type
Figure 4. Abundance (mean ± 1 SE) of (A) logs, (B) snags, and (C) stumps per 10 m × 10 m
plot before (Survey 1) and 3 years after (Survey 2) restorations occurred at the treated sites.
(D) The mean total abundance of logs, snags, and stumps per 10 m × 10 m plot.
Northeastern Naturalist Vol. 24, No. 4
D.E. Haskell1, C.R. Webster, A.L. Bales, M.W. Meyer, and D.J. Flaspholer
2017
401
Figure 5. Total gap fraction (mean ± 1 SE) as measured at 0.5 m (A) and 1.5 m (B) heights
before (Survey 1) and 3 years after (Survey 2) restoration occurred at the treated sites. Treatments
having any letter in common (A, B, and/or C) are not statistically different from one
another (P > 0.05) based on Tukey’s honest significant difference (HSD) tests (Tukey’s test
used only when interaction effect was significant).
Northeastern Naturalist
402
D.E. Haskell1, C.R. Webster, A.L. Bales, M.W. Meyer, and D.J. Flaspholer
2017 Vol. 24, No. 4
(i.e., significant interaction; F2, 79 = 3.42, P = 0.038). Here, reference plots experienced
an increase in gap fraction between survey years, while control and treated
plots experienced a slight decrease in gap fraction (Fig. 5B). Results from Tukey’s
HSD tests indicated that for the first survey the reference plots had a significantly
lower gap fraction than both pre-restoration control and treated plots (Fig. 5B).
Gap fraction also varied between lakes, but the effect was only marginally significant
(F2, 79=2.56, P = 0.061).
Nonmetric multi-dimensional scaling ordination
Habitat attribute data were best described by a 3-dimensional ordination solution.
The solution has a final stress of 10.97 and instability of less than 0.00001 after 94
iterations. The ordination explained 93.1% of the variation in habitat attribute
composition, with axis 1 explaining the most variation (54.2%) followed by axis 2
(22.6%) and axis 3 (16.2%), respectively. Visual inspection of the ordination plots
suggested that reference lakes exhibited little change in habitat feature composition
between our sample periods (Figs. 6, 7C). Restored lakeshores on the other hand,
displayed longer vectors and movement towards reference conditions (Figs. 6,
7A–B). This increase in similarity was associated with increasing similarity in visual
obstruction density (MPVOpM, MPVO1M, MPVO2M, MPVO3M) and shrub
(ShDen/ha) and sapling (SaDen/ha) density among treatments and reference lakes
(Table 3). The Found Lake control plots also displayed a large change in habitat
feature composition associated with an increase in visual obstruction but did not
tend as clearly towards the domain occupied by the reference lakes (Fig. 6).
Table 3. Correlations between nonmetric multi-dimensional scaling ordination axes and wildlife habitat
attributes at reference and lakeshore restoration sites. Se e Figure 6 for variable definitions.
Axis 1 (R2 = 0.542) Axis 2 (R2 = 0.226) Axis 3 (R2 = 0.162)
Habitat attribute r tau r tau r tau
%ConBA/ha -0.585 -0.235 0.047 0.082 0.417 0.364
1p5mGpFc 0.479 0.478 0.164 0.020 0.232 0.160
BAsqM/ha -0.765 -0.552 -0.06 -0.051 0.326 0.257
ConBAsqM -0.787 -0.554 -0.051 -0.038 0.426 0.350
MeanDBHc 0.384 0.222 0.154 0.019 0.565 0.357
MPVO1M -0.139 -0.079 0.825 0.657 -0.235 -0.161
MPVO2M -0.267 -0.207 0.784 0.617 -0.225 -0.126
MPVO3M -0.361 -0.249 0.687 0.534 -0.194 -0.091
MPVOp3M -0.007 -0.001 0.726 0.539 -0.290 -0.224
p5mGpFrc 0.750 0.565 -0.046 -0.063 0.181 0.129
ShDen/ha 0.250 0.163 0.419 0.271 0.083 -0.075
SpDen/ha -0.174 -0.112 0.483 0.365 -0.376 -0.266
SWIEven -0.027 0.210 -0.226 -0.093 -0.744 -0.470
SWIndex -0.268 -0.100 -0.177 -0.066 -0.769 -0.573
TrDen/ha -0.872 -0.806 -0.034 -0.009 -0.033 -0.002
TrSpRich -0.549 -0.414 -0.109 -0.090 -0.534 -0.385
Northeastern Naturalist Vol. 24, No. 4
D.E. Haskell1, C.R. Webster, A.L. Bales, M.W. Meyer, and D.J. Flaspholer
2017
403
Figure 6. Nonmetric
multi-dimensional scaling
ordination of wildlife
habitat attributes on
reference and restored
lakeshores. Data was
collected prior to restoration
and 3 years
post restoration. (A)
Mean location of sample
plots through time
are indicated by vectors
(LSG = Little St.
Germain). (B) Location
of habitat attributes in
the ordination space.
Minor adjustments to
locations were made
to improve readability
of abbreviated attribute
titles. Correlations with
ordination axes are provided
in Table 3. Attributes
are as follows:
%ConBA/ha = percent
conifer basal area per
hectare; p5mGpFrc =
canopy gap fraction at
0.5 m height; 1p5GpFrc
= canopy gap fraction at
1.5 m height; BAsqM/
ha = basal area square
meter per hectare; Con-
BAsqM = conifer basal
area in square meter
per hectare; MeanDBHc
= average diameter
at breast height
in centimeters for all
tree species; MPVOpM
= mean percent visual
obstruction density at
0–0.3 m height; MPVO1M = mean percent visual obstruction density at >0.3–1 m height;
MPVO2M = mean percent visual obstruction density at >1–2 m height; MPVO3M = mean
percent visual obstruction density at >2–3 m height; SaDen/ha = sapling density per hectare;
ShDen/ha = shrub density per hectare; SWIndex = Shannon–Weiner diversity (H') index of
tree species; SWIEven = Shannon–Weiner evenness; TrDenHa = Tree density per hectare;
TrSpRich = total number of tree species richness.
Northeastern Naturalist
404
D.E. Haskell1, C.R. Webster, A.L. Bales, M.W. Meyer, and D.J. Flaspholer
2017 Vol. 24, No. 4
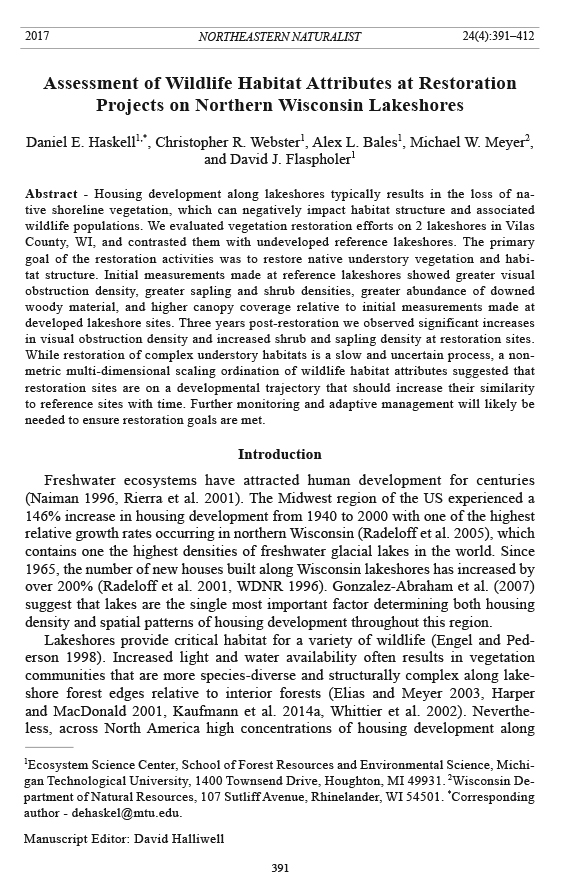
Figure 7. Photographs
showing conditions (A)
pre-restoration and (B)
post-restoration on Found
Lake, WI, and at (C) a
reference site on Escanaba
Lake, WI. (Photographs ©
D.E. Haskell).
Northeastern Naturalist Vol. 24, No. 4
D.E. Haskell1, C.R. Webster, A.L. Bales, M.W. Meyer, and D.J. Flaspholer
2017
405
Discussion
Our initial measurements made at reference lakes revealed greater visual obstruction
density at all height classes, greater densities of saplings and shrubs,
greater amounts of downed woody material and more canopy coverage (lower gap
fraction) relative to initial measurements made at restoration sites. These findings
are consistent with previous measurements made at developed and undeveloped
lakes within the Northern Highlands Ecological Landscape (Elias and Meyer
2003), where quantitative comparisons of vegetative structural characteristics (e.g.,
canopy cover, sub-canopy and understory vegetation layers, and amount of coarse
woody debris) showed significantly greater complexity and cover at undeveloped
versus developed lakeshores. Our finding was also similar to northeastern US lakes
reported by Whittier et al. (2002) and for lakes in all regions of the contiguous US
by Kaufmann et al. (2014a). Whittier et al. (2002) showed that Northeastern lakes
with no housing development had median canopy cover of 67% and median cover
of combined canopy, mid-layer, and ground cover of 170%, contrasted with 35%
canopy cover and 82% combined for the 3 vegetation layers for all developed shoreline
stations.
Our visual obstruction density measurements conducted 3 years following implementation
of restoration projects on developed lakes showed significant increases in
visual obstruction density at the 0.0–0.3 m height class and a marginally significant
increase at the >0.3–1.0 m height class. Visual obstruction density increased significantly
between surveys overall at height classes above 1.0 m, but this did not vary
significantly among treatments. Because vegetation planted at restored sites was
generally less than 1.0 m in height, it seems likely that several more growing seasons are required
to detect a strong effect from our restoration efforts at these height classes. A
separate restoration project on a degraded lakeshore within the Northern Highlands
Ecological Landscape, which implemented the same planting density, showed 2–3
times move coverage of vegetation at heights above 1.0 m for restored sites relative
to control sites 5 years post-restoration (D.E. Haskell, unpubl. data), which together
with our findings suggest it might generally take longer than 3 years for restored
sites to diverge from unrestored control sites at these taller height classes.
Shrub and sapling density also increased at restoration sites as expected, but the
increase was only statistically significant for shrubs. This result was likely influenced
by the planting density prescribed in the “Wisconsin Biology Technical Note
1: Shoreland Restoration” (NRCS 2002), where shrub-planting densities are thrice
those of saplings. In addition, the low shrub density at reference sites could be the
result of shading of the lower layers by the increased canopy cover. A companion
lakeshore restoration project located within the area, compared sapling and shrub
densities on active and natural recovery plots with fence and irrigation over a 5-year
period (D.E. Haskell, unpubl. data). The results showed no significant difference of
sapling densities; however, there was significant differences in shrub densities between
treatments with natural recovery having little change in densities. The results
suggest that regeneration of saplings can occur over time if there is a seed source
and that a shrub component should be restored. For this study, we did not monitor
Northeastern Naturalist
406
D.E. Haskell1, C.R. Webster, A.L. Bales, M.W. Meyer, and D.J. Flaspholer
2017 Vol. 24, No. 4
the sites for regeneration during the project time period. Practitioners may wish to
adjust planting densities to better reflect those found on reference sites or to hasten
development of the sapling layer.
In an urban lakeshore restoration study, Galbraith-Kent and Handel (2007)
reported a 48% decrease of woody stem density over a 3-year period in Flushing
Meadows Corona Park, NY. Their site was not fenced, and the reasons for the decline
were herbivory and human vandalism (plants illegally removed and arson).
Vanderbosch and Galatowitch (2010) surveyed 22 lakeshore restoration projects
in Minnesota and reported that restoration sites with fencing had a higher species
richness than sites without fencing. In northern Wisconsin, Haskell et al. (2013)
reported the relative abundance of White-tailed Deer was 3 times higher on lakeshores
where human development was present, supporting the need for herbivory
abatement on restoration sites. Fencing is a common abatement technique in habitat
restoration projects to protect young plants from herbivory (Case and Kaufman
1997, Opperman and Merenlender 2000). For example, Case and Kaufman (1997)
reported crown volume increase of 550% for Salix spp. (willows) within exclosures
compared to an increase of 195% outside of exclosures. Similarly, Opperman and
Merenlender (2000) observed saplings had a higher rate of survival in exclosures
compared to saplings with no protection from browse, and 97% of saplings outside
exclosures suffered from stem and leaf damage characteristic of White-tailed Deer
browse. Thus, the importance of protecting the restoration sites with a fence or other
abatements systems is critical in early establishment of plants. Further monitoring
on our restoration sites following fence removal is warranted and may provide practitioners
useful insight into the resilience of plants to herbivory.
Our reference sites had significantly more coarse woody debris than restored and
control sites overall, which is consistent with results presented by Elias and Meyer
(2003), Christensen et al. (1996), and Whittier et al. (2002). Kaufmann et al. (2014b)
reported a positive association of native fish and bird species richness along lakeshores
with the presence of course woody material in the near shore littoral zone of
northeastern lakes. While there was a modest non-significant increase in dead wood
at restoration sites, augmentation in excess of in situ mortality and breakage of scattered
residual canopy trees may be highly desirable in shoreline restoration settings.
For example, Haskell et al. (2012) found that adding as little as 25% coverage of
woody material, in the form of logs up to 15 cm in diameter and 3 m in length, in 3 m
x 3 m plots on lakeshores improved plant growth and can moderate soil moisture and
temperatures on degraded lakeshores. Adding course woody debris to restoration
sites could have a positive impact on wildlife species abundance and distribution
across landscapes (Maser et al. 1979, McComb 2016). For example, Mac Nally
and Horrocks (2002) reported an increase in forest-floor mammal densities after
1 year when the quantity of new fallen timber was increased and re-distributed in
floodplain forests of Australia. Furthermore, it is well documented that dead wood
provides habitat for a wide variety of wildlife species, especially invertebrates, and
provides nursery sites for plants (Harmon et al. 1986, Maser et al. 1979, McComb
2016, McMinn and Crossley 1996). Variability in the amount, size, and distribution
Northeastern Naturalist Vol. 24, No. 4
D.E. Haskell1, C.R. Webster, A.L. Bales, M.W. Meyer, and D.J. Flaspholer
2017
407
of course woody debris is considerable across regions, landscapes, and forest types
(McComb 2016). The amount of course woody debris available to lakeshores is
related to the vegetation structure in the area (Christensen et al. 1996). While restoring
trees and shrubs on human-developed lakeshores will provide woody material
through natural succession, trees grow slowly and it may take decades to centuries
for course woody debris to be replenished naturally along human-developed lakeshores
(Christensen et al. 1996). Thus, augmentation of course woody debris should
be considered on severely denuded lakeshores. However, we advise consulting with
local zoning ordinances before restoring course woody debris to riparian-littoral
areas, as it may be necessary to acquire a permit.
Nonmetric multi-dimensional scaling ordination of habitat attributes suggests
that over time restoration sites are becoming more similar to reference
sites based on the composition of their habitat attributes. Reference lakes, as
expected, showed relatively little change in habitat attribute composition between
our sample periods. Treatment lakes, on the other hand, displayed longer
vectors and movement towards reference conditions. This trend was associated
with increasing similarity in visual obstruction and shrub and sapling density
among treatments and reference lakes. The Found Lake control also displayed a
large change in habitat feature composition associated with an increase in visual
obstruction but did not trend as clearly towards the domain occupied by the reference
lakes. Collectively, these results suggest that changes in understory habitat
conditions associated with restoration treatments may increase the similarity of
habitat features for understory dwelling wildlife. Large structural changes (tree
density, size, and diversity) will require more time, but improving understory
conditions and diversity are a requisite first step.
Habitat is not static, but continually changes because of natural and/or anthropogenic
disturbances that operate at many scales (Engstrom et al. 1999). Thus,
restoring wildlife habitat requires not only an understanding of the requirements
of species but also the processes that maintain the habitat over time (George and
Zack 2001). Therefore, we stress that a long-term monitoring of lakeshore restoration
sites should be part of the restoration plan and that strategies to further
this goal should be tested. We recommend future large-scale lakeshore rehabilitation
projects be led by trusted property owners such as lake-association officers,
private-sector business owners, or private-consultant firms who can facilitate effective
peer-to-peer learning and project buy-in. Landowners should be involved at all
stages of planning and be encouraged to participate during the restoration activities
and monitoring. Naturally vegetated lakeshores have a strong aesthetic appeal
(Korth 1994) and protect water quality (Engel and Pederson 1998), which can lead
to increased property values (Michael et al. 1996). Restoring sections of lakeshores
that are severely altered by a human activity can improve whole-lake ecological
integrity (Lorenz et al. 2017). These considerations should motivate policy makers
to establish programs that will encourage lakeshore owners to participate in restoring
wildlife habitat and educate property owners of the ecological importance of
preserving a natural vegetated buffer zone adjacent to lakeshores.
Northeastern Naturalist
408
D.E. Haskell1, C.R. Webster, A.L. Bales, M.W. Meyer, and D.J. Flaspholer
2017 Vol. 24, No. 4
Acknowledgments
This project could not have been possible without the participatory collaboration of
numerous private landowners on Found and Little St. Germain Lakes. Private landowners’
included in this research project showed a strong desire to preserve the integrity of the local
lake ecosystems. Funding for this project was supported by the Wisconsin DNR with Federal
Aid in Wildlife Restoration Project W-160-P funds, county cost-share dollars administered
by the Vilas County Land and Water Conservation Department, Wisconsin Department of
Agriculture and Consumer Protection, Moon Beach, United Church Camps, Inc., USDA
McIntire-Stennis Program, and Michigan Technological University Ecosystem Science
Center. A special thanks to M. Woodford for providing GIS skills to this project. M. Marquita,
P. Goggin, and B. Hanson provided advice on plant species and restoration plans. We offer
huge thanks for all the field technicians over the years: D. Drekich, C. Mehls, D. McGary, T.
Armstrong, M. Pytleski, M. Jarvi, A. Komar, J. Links, E. Delcamp, M. Boehmeer, E. Bowen,
Quita, K. Merical, S. Simestad, A. Nachel, A. Bowen, C. Waas, K. Genther N. Comar, K.
Kelly, C. Delzer, E. Collins, J. Wheeler, A. Sharp, A. Van Wagner, G. Brammer. We are grateful
to B. Fevold, who provided QA/QC and database management services.
Literature Cited
Anderson, S.H., and H.H. Shugart Jr. 1974. Habitat selection of breeding birds in and east
Tennessee deciduous forest. Ecology 77:215–227.
Bibby, C.J., N.D. Burgess, and D.A. Hill. 1992. Bird Census Techniques. Academic Press,
London, UK 302 pp.
Blanchette, P., J.C. Bourgeois, and S. St-Onge. 2007. Ruffed Grouse winter habitat use in
mixed softwood-hardwood forests, Québec, Canada. Journal of Wildlife Management
71:1758–1764.
Buskirk, S.W., and R.A. Powell. 1994. Habitat ecology of Fishers and American Martens.
Pp. 283–296, In S.W. Buskirk, A.S Harestad, M.G. Raphael, and R.A. Powel (Eds). Martens,
Sables, and Fishers: Biology and Conservation. Cornell University Press, Ithaca,
NY. 484 pp
Case, R.L., and J.B. Kaufman. 1997. Wild ungulate influences on the recovery of willows,
Black Cottonwood, and Thin-leaf Alder following cessation of cattle grazing in northwest
Oregon. Northwest Science 71:115–126.
Christensen, D.L., B.R. Herwig, D.E Schindler, and S.R. Carpenter. 1996. Impacts of lakeshore
residential development on coarse woody debris in north temperate lakes. Ecological
Applications 6:1143–1149.
Clark, K.L., D.L. Euler, and E. Armstrong. 1984. Predicting avian community response to
lakeshore cottage development. Journal of Wildlife Management 48:1239–1247.
Curtis, J.T. 1959. The Vegetation of Wisconsin. University of Wisconsin Press, Madison,
WI. 657 pp.
Czech, B., P.R. Krausman, and P.K. Devers. 2000. Economic associations among causes of
species endangerment in the United States. BioScience 50:593–601.
DeGraaf, R.M., and M. Yamasaki. 2003. Options for managing early-successional forest
and shrubland bird habitats in northeastern United States. Forest Ecology and Management
185:179–191.
Dickson, J.G. 1992. The Wild Turkey: Biology and Management. Stackpole Books, Mechanicsburg,
PA. 463 pp.
Northeastern Naturalist Vol. 24, No. 4
D.E. Haskell1, C.R. Webster, A.L. Bales, M.W. Meyer, and D.J. Flaspholer
2017
409
Ehrlich P., D.S. Dobkin, and D. Wheye. 1998. The Birder’s Handbook: A Field Guide to
the Natural History of North American Birds. Simon and Schuster, Fireside, New York,
NY. 783 pp.
Elias, J.E., and M.W. Meyer. 2003. Comparisons of undeveloped and developed shorelands,
northern Wisconsin, and recommendations for restoration. Wetlands 23:800–816.
Engel, S. and J.L. Pederson Jr. 1998. The construction, aesthetics, and effects of lakeshore
development: A literature review. Wisconsin Department of Natural Resources PUBLSS-
577-99. 45 pp. Madison, WI.
Engstrom, R.T., S. Gilbert, M.L. Hunter, Jr., D. Merriwether, G. J. Nowacki, and P. Spencer.
1999. Practical applications of disturbance ecology to natural resources management.
Pp. 313–330, In N.C. Johnson, A.J. Malk, W.T. Sexton, and R. Szaro (Eds.). Ecological
Stewardship: A Common Reference for Ecosystem Management. Volume 2. Elsevier
Science Ltd., Oxford, UK. 1500 pp.
Galbraith-Kent, S.L., and S.N. Handel. 2007. Lessons from an urban lakeshore restoration
project in New York City. Ecological Restoration 25:123–128.
George, T.L., and S. Zack. 2001. Spatial and temporal considerations in restoring habitat
for wildlife. Restoration Ecology 9:272–279.
Gilbert, J.H., J.L. Wright, D.J. Lauten, and J.R. Probst. 1997. Den and rest-site characteristics
of American Marten and Fisher in northern Wisconsin. Pp. 135–145 In G. Proulx,
H.N. Bryant, and P.M. Woodard (Eds). Martes: Taxonomy, Ecology, Techniques, and
Management. Provincial Museum of Alberta, Edmonton, AB, Canada. 474 pp.
Gonzelez-Abraham, C.E., V.C. Radeloff, R.B. Hammer, T.J Hawbaker, S.I. Stewart, and
M.K. Clayton. 2007. Building patterns and landscape fragmentation in northern Wisconsin,
USA. Landscape Ecology 22:217–230.
Goodrum, P.D., V.H. Reid, and C.E. Boyd. 1971. Acorn yields, characteristics, and management
criteria of oaks for wildlife. Journal of Wildlife Management 35:520–532.
Harmon, M.E, J.F. Franklin, and F.J. Swanson. 1986. Ecology of course woody debris in
temperate ecosystems. Advanced Ecological Research 15:133–302.
Harper, K.A., and S.E. MacDonald. 2001. Structure and composition of riparian boreal forest:
New methods for analyzing edge influence. Ecology 82:649–65 9.
Haskell, D.E. 2009. Quantifying the ecological benefits of lakeshore restoration in northern
Wisconsin. M.Sc. Thesis. Michigan Technological University, Houghton, MI. 101 pp.
Haskell, D.E., Flaspolher, D.J., Webster, C.R., M.W. Meyer. 2012. Variation in soil temperature,
moisture, and plant growth with the addition of downed woody material on
lakeshore restoration sites. Restoration Ecology 20:113–121.
Haskell, D.E., M.W. Meyer, C.R. Webster, and D.J. Flaspolher. 2013. The relationship between
carnivore distribution and landscape features in the Northern Highlands ecological
landscape of Wisconsin. American Midland Naturalist 169:1–16.
Hobbs, R.J., and J.A. Harris. 2001. Restoration ecology: Repairing the earth’s ecosystem
in the new millennium. Restoration Ecology 4:93–110.
Hunter, M.L. and F.K.A. Schmiegelow. 2011. Wildlife, Forests, and Forestry: Principles
of Managing Forests for Biological Diversity. Prentice Hall, Upper Saddle River, NJ.
259 pp.
Jaeger, R.G. 1980. Microhabitats of a terrestrial forest salamander. Copeia 1980(2):265–268.
Jennings, M.J., M.A. Bozek, G.R. Hatzenbeler, E.E. Emmons, and M.D. Staggs. 1999.
Cumulative effects of incremental shoreline habitat modification on fish assemblages
in north temperate lakes. North American Journal of Fisheries Management 19:18–27.
Kaufmann, P.R., D.V. Peck, S.G. Paulsen, C.W. Seeliger, R.M. Hughes, T.R. Whittier, and
N.C. Kamman. 2014a. Lakeshore and littoral physical habitat structure in a national
lakes assessment. Lake and Reservoir Management 30:192–215.
Northeastern Naturalist
410
D.E. Haskell1, C.R. Webster, A.L. Bales, M.W. Meyer, and D.J. Flaspholer
2017 Vol. 24, No. 4
Kaufmann, P.R., R.M. Hughes, T.R. Whittier, S.A. Bryce, and S.G. Paulsen. 2014b. Relevance
of lake physical habitat assessment indices to fish and riparian birds. Lake and
Reservoir Management 30:177–191.
Korth, R.M. 1994. Why do we enjoy Wisconsin’s Lakes?: Survey results. Lake Tides 19:3.
Lindsay, A.R., S.S. Gillum, and M.W. Meyer. 2002. Influence of lakeshore development
on breeding bird communities in a mixed northern forest. Biological Conservation
107:1–11.
Lorenz, S., M.T. Pusch, O. Miler, and U. Blaschke. 2017. How much ecological integrity
does a lake need: Managing the shores of a peri-urban lake. Landscape and Urban Planning
164:91–98.
MacArthur, R.H., and J.W. MacArthur. 1961. On bird species diversity. Ecology 42:594-598.
Macbeth, E.J. 1992. Protecting aesthetics and the visual resource of lakes. Pp. 17–23, In
Enhancing the States’ Lake Management Programs. North American Lake Management
Society, Washington, DC. 112 pp.
Mac Nally, R., and G. Horrocks. 2002. Habitat change and restoration: Responses of a
forest-floor mammal species to manipulations of fallen timber in floodplain forests.
Animal Biodiversity and Conservation 25:41–52.
Marburg, A.E, M.G. Turner, and T.K Kratz. 2006. Natural and anthropogenic variation in
coarse wood among and within lakes. Journal of Ecology 94:558–568.
Martin, A.C., H.S. Zim, and A.L. Nelson. 1961. American Wildlife and Plants: A Guide to
Wildlife Food Habits: The Use of Trees, Shrubs, Weeds and Herbs by Birds and Mammals
of the United States. Dover Publications, New York, NY. 499 pp.
Maser, C., R.G. Anderson, K. Cromack Jr., J.T. Williams, and R.E. Martin. 1979. Dead and
down woody material. Pp.78–95. In J.W. Thomas (Ed). Wildlife Habitats in Managed
Forest: The Blue Mountains of Oregon and Washington, Agricultural Handbook No.
553. USDA Forest Service, Washington, DC. 512 pp.
McComb, B.C. 2016. Wildlife Habitat Management: Concepts and Applications in Forestry.
CRC Press, Boca Raton, FL. 385 pp.
McCune, B., and J.B. Grace. 2002. Analysis of Ecological Communities. MjM Software
Design, Gleneden Beach, OR. 300 pp.
McMinn, J.W., and D.A. Crossley (Eds.). 1996. Biodiversity and coarse woody debris in
southern forests. USDA Forest Service General Technical Report SE-94. Southern Research
Station, Asheville, NC. 156 pp.
Michael, H.J., K.J.Boyle, and R. Bouchard. 1996. Water quality affects property prices: A
case study of selected Maine lakes. Maine Agricultural and Forest Experimental Station
Miscellaneous Report 398. University of Maine, Orono, ME. 15 pp.
Mooty, J.J., Karns P.D., and Fuller, T.K. 1987. Habitat use and seasonal range size of Whitetailed
Deer in northcentral Minnesota. Journal of Wildlife Management 51:644–648.
Morrison, M.L. 2002. Wildlife Restoration: Techniques for Habitat Analysis and Animal
Monitoring. Island Press, Washington, DC. 209 pp.
Morrison, M.L., B.G. Marcot, and R.W. Mannan. 1998. Wildlife–Habitat Relationships:
Concepts and Applications. University of Wisconsin Press, Madison, WI. 435 pp.
Moyle, J.B. and N. Hotchkiss. 1945. The aquatic and marsh vegetation of Minnesota and
its value to waterfowl. Minnesota Department of Conservation, St. Paul, MN. Technical
Bulletin 3. 122 pp.
Naiman, R.J. 1996. Water, society and landscape ecology. Landscape Ecology 11:193–196.
Newbrey. J.L., M.A Bozek, and N.D. Niemuth. 2005. Effects of lake characteristics and human
disturbance on the presence and of piscivorous birds in northern Wisconsin, USA.
Waterbirds 28:478–486.
Northeastern Naturalist Vol. 24, No. 4
D.E. Haskell1, C.R. Webster, A.L. Bales, M.W. Meyer, and D.J. Flaspholer
2017
411
Natural Resource Conservation Service (NRCS). 1986. Soil survey of Vilas County. United
States Department of Agriculture, Washington, DC. 157 pp.
NRCS (Natural Resource Conservation Service). 2002. Wisconsin biology technical note 1:
Shoreland habitat. NRCS. Available online at http://dnr.wi.gov/topic/shorelandzoning/
documents/nrcsbiotechnote.pdf. Accessed 26 March 2007.
Opperman, J.J., and A.M. Merenlender. 2000. Deer herbivory as an ecological constraint to
restoration of degraded riparian corridors. Restoration Ecology 8:41–47.
Racey, G.D., and D.L. Euler. 1982. Small mammal and habitat response to shoreline cottage
development in central Ontario. Canadian Journal of Zoology 60:865–880.
Racey, G.D., and D.L. Euler. 1983a. Changes in mink habitat and food selection as influenced
by cottage development in central Ontario. Journal of Applied Ecology 20:387-402.
Racey, G.D., and D.L. Euler. 1983b. An index of habitat disturbance for lakeshore cottage
development. Journal of Environmental Management 16:173–179.
Radeloff, V.C., R.B. Hammer, P.R. Voss, A.E. Hagen, D.R. Field, and D.J. Mladdenoff.
2001. Human demographics trends and landscape level forest management in the northwest
Wisconsin Pine Barrens. Forest Science 47:229–241.
Radeloff, V.C., R.B. Hammer, and S.I. Stewart. 2005. Rural and suburban sprawl in the US
Midwest from 1940 to 2000 and it relation to forest fragmentation. Conservation Biology
19:793–805.
Radomski, P., and T.J. Goeman. 2001. Consequences of human lakeshore development on
emergent and floating-leaf vegetation abundance. North American Journal of Fishery
Management 21:46–61.
Riera, J., P.R. Voss, S.R. Carpenter, T.K. Kratz, T.M. Lillesand, J.A. Schnaiberg, M.G.
Turner, and M.W. Wegener. 2001. Nature, society, and history in two contrasting landscapes
in Wisconsin, USA: Interactions between lakes and humans during the twentieth
century. Land Use Policy 18:41–51.
Robertson, R.J., and N.J. Flood. 1980. Effects of recreational use of shorelines on breeding
bird populations. Canadian Field Naturalist 94:131–138.
Rusch D.H., S. DeStefano, M.C. Reynolds, and D. Lauten. 2000. Ruffed Grouse (Bonasa
umbellus). No. 515, In A. Poole and F. Gills (Eds). The Birds of North American. The
Birds of North America, Inc., Philadelphia, PA.
SAS Institute Inc. 2015. JMP verison Pro 12.1.0, 100 SAS Campus Drive, Gary, NC 27513.
Sass, G.G., J.F. Kitchell, S.R. Carpenter, T.R. Hrabik, A.E. Marburg, M.G. Turner. 2006.
Fish community and food web responses to a whole-lake removal of coarse woody habitat.
Fisheries 31:321–330.
Schindler, D.E., S.I. Geib, and M.R. Williams. 2000. Patterns of fish growth along a residential-
development gradient in north temperate lakes. Ecosystems 3:229–237.
Schnaiberg, J., J. Riera, M.G. Turner, and P.R. Voss. 2002. Explaining human settlement
patterns in a recreational lake district: Vilas County, Wisconsin, USA. Environmental
Management 30:24–34.
Society for Ecological Restoration International Science and Policy Working Group (SER).
2004. The SER International Primer on Ecological Restoration. Tucson, AZ. Available
online at http://c.ymcdn.com/sites/www.ser.org/resource/resmgr/custompages/publications/
ser_publications/ser_primer.pdf. Accessed 1 April 2007.
Tallmon, D.A., and L.S. Mills. 1994. Use of logs within home ranges of California redbacked
voles on remnant forest. Journal of Mammalogy 74:91–101.
Theobald, D.M, and J.R. Miller, N.T. Hobbs. 1997. Estimating the cumulative effects of
development on wildlife habitat. Landscape and Urban Planning 39:25–36.
Northeastern Naturalist
412
D.E. Haskell1, C.R. Webster, A.L. Bales, M.W. Meyer, and D.J. Flaspholer
2017 Vol. 24, No. 4
Thwaites, F.T., 1929. Glacial geology of part of Vilas County, Wisconsin. Transactions of
the Wisconsin Academy of Sciences, Arts, and Letters 24:109–125.
Vanderbosch, D.A., and S.M. Galatowitsch. 2010. An assessment of urban lakeshore restorations
in Minnesota. Ecological Restoration 28:71–80.
Whittier, T.R., S.G. Paulsen, D.P. Larsen, S.A. Peterson, A.T. Herlihy, and P.R. Kaufman.
2002. Indicators of ecological stress and their extent in the population of northeastern
lakes: Regional-scale assessment. Bioscience 52:235–247.
Wilcove, D.S., D. Rothstein, J. Bubow, A. Phillips, and E. Loso. 1998. Quantifying threats
to imperiled species in the United States. Bioscience 48:607–615.
WinScanopy. 2005. WinSCANOPY 2005a for hemispherical image analysis. Regent Instruments,
Inc., Québec City, QC, Canada.
Wisconsin Department of Natural Resources (WDNR). 1996. Northern Wisconsin’s Lakes
and Shorelands: A report examining a resource under pressure. Madison, WI. 18 pp.
WDNR. 2005. Wisconsin Lakes. Bureau of Fisheries and Habitat Management. PUB- FH-
800. Madison, WI 180 pp.
WDNR. 2014a. The ecological landscapes of Wisconsin: an assessment of ecological resources
and a guide to planning sustainable management. Chapter 14, Northern Highland
Ecological Landscape. PUB-SS-1131. Madison, WI. 84 pp
WDNR. 2014b. Wisconsin’s shoreland protection program. Available online at http://docs.
legis.wisconsin.gov/code/admin_code/nr/100/115.pdf. Accessed 11 July 2014.
Woodford, J.E., and M.W. Meyer. 2003. Impact of lakeshore development on Green Frog
abundance. Biological Conservation 110:277–284.

