2012 NORTHEASTERN NATURALIST 19(2):279–296
Parsimony Analysis of East Coast Salt Marsh Plant
Distributions
Joseph W. Rachlin1,*, Richard Stalter2, Dwight Kincaid3, and
Barbara E. Warkentine1,4
Abstract - A parsimony algorithm was used to evaluate the distribution and co-occurrence
of 46 vascular salt marsh-associated species in 20 coastal salt marshes from
Biscayne Bay National Park, FL, to Sable Island Marine Protected Sanctuary, NS,
Canada. The method considers each salt marsh as if it were a taxon, and the presence
or absence of a particular vascular plant species as a “character state” of that taxon. Using
this information, a 20 x 46 data matrix was created and examined by multivariate
ordination techniques and by parsimony analysis using the program WinClada running
over NONA. A hierarchical clustering showed that the salt marsh sites on the eastern
seaboard of North America formed two main clusters, one including all of the Florida
sites and South Carolina, and the second including all of the more northern sites: North
Carolina, Virginia, New Jersey, New York, and Sable Island, NS, Canada. Within the
large southern cluster, we find two major sub-clusters separating the Florida marshes
from those of South Carolina. Likewise, within the large northern cluster, we find two
major sub-clusters separating North Carolina and Virginia from the other northern
marshes. An essentially similar pattern of site grouping was also observed using the
ordination technique of non-metric multidimensional scaling, in which the southern
marshes all aligned to the left of the origin, while the more northern marshes align to its
right. Parsimony analysis yielded twelve equally parsimonious trees from which a strict
consensus tree was constructed. The topology of the consensus tree clearly shows two
major clades, a southern one and a northern one, with the division occurring between
South and North Carolina. The main southern clade is supported by the presence of
Sporobolus virginicus (Seashore Dropseed), while the main northern clade is supported
by the presence of Ruppia maritima (Widgeongrass). Spartina alterniflora (Smooth or
Atlantic Cordgrass), which we take as the single species that defines the salt marsh on
the eastern coast of North America, was present in all of the sampled sites except Biscayne
Bay National Park, FL, a mangrove swamp.
Introduction
The techniques of hierarchical clustering and ordination has been shown to
have great value as an explorative tool for finding and evaluating patterns in
ecological data (Gauch 1982; Legendre and Legendre 1998; Manly 2005, 2007;
1Laboratory for Marine and Estuarine Research (La MER), Department of Biological Sciences,
Lehman College, City University of New York, 250 Bedford Park Boulevard West,
Bronx, NY 10468-1589. 2Department of Biological Sciences, St. John’s University, 8000
Utopia Parkway, Queens, NY 11439. 3Department of Biological Sciences, Lehman College,
City University of New York, 250 Bedford Park Boulevard West, Bronx, NY 10468-
1589. 4Science Department, SUNY Maritime College, 6 Pennyfield Avenue, Bronx, NY
10465-4198. *Corresponding author - joseph.rachlin@lehman.cuny.edu.
280 Northeastern Naturalist Vol. 19, No. 2
McCune and Grace 2002; Pielou 1984). That parsimony analysis also has a place
in recognizing ecological patterns was initially demonstrated by Lambshead
and Paterson (1986) in their seminal paper on the use of numerical cladistics in
analyzing ecological data, and more recently by Rachlin et al. (2008) in their
evaluation of ichthyofaunal distribution and co-occurrence in an urban stream;
by Herrera-Vasquez et al. (2008) to demonstrate that the freshwater ichthyofauna
of Costa Rica formed two panbiogeographic tracks, an Atlantic and a Pacific
along the length of the country; and by Wenzel and Luque (2008) in their study
of ecological succession and changes in community structure.
Following from these studies, the goal of this current study is to further
demonstrate the efficacy of using parsimony analysis as a tool for ecological
exploratory analysis, along with more conventional multivariate analyses such
as hierarchical cluster analysis and non-metric multidimensional scaling. In all of
these studies, sampling sites are treated as “taxa” and the species, either as abundance
or simply the presence or absence of the species of interest at the sampled
sites, are treated as “character states” of those “taxa”; it is our hypothesis that
parsimony analysis would partition the sampled sites, based on their vegetation,
in an analogous manner to that obtained by the other multivariate techniques
used. Further, the graphic display of the parsimony analysis would explicitly
show the co-occurrence of the salt marsh vegetation on a site-by-site basis,
which is not available in hierarchical cluster analysis, non-metric multidimensional
scaling, nor other multivariate or grouping procedures. The value of such
a graphic display of the distribution of these plants among the various sites and
their co-occurrence or community structure as elucidated by parsimony analysis
provides the desired detail to allow for future studies of the various factors which
constrain these distributions and community structures.
In the papers by Rachlin et al. (2008) and Wenzel and Luque (2008), parsimony
analysis was performed using the program WinClada (Nixon 2002) running
over NONA (Goloboff 1993). Both programs are available at http://www.cladistics.
com. The advantage of using these programs is that in the graphical output
the sites are shown as terminal “taxa” and the species as “character states” of
those “taxa”, which are plotted explicitly on the topology of the tree or trees
generated by the analysis. Further, those species uniquely supporting a clade or
being unique to a site are differentially marked and identified from those species
not uniquely supporting a clade and/or not unique to a site—that is they occur in
more than one position in the generated topology of sites.
In the present study, to further demonstrate the efficacy of using parsimony
analysis to uncover patterns of species distribution and co-occurrence in ecological
data, we turned our attention to the salt marsh communities of the east coast
of North America. Using the published data generated by one of us (R. Stalter),
who has been studying the floristics of these salt marsh communities for over
thirty-six years, we extracted a data set of 46 vascular salt marsh species distributed
in 20 sites from Florida north to Sable Island, Canada. Nineteen of these
sites are salt marshes as defined by the presence of Spartina alterniflora Loisel
2012 J.W. Rachlin, R. Stalter, D. Kincaid, and B.E. Warkentine 281
(Atlantic Cordgrass) and one, Biscayne Bay National Park, FL, that is considered
a mangal because of the presence of all four species of mangrove plants: Avicennia
germinans L. (Black Mangrove), Conocarpus erectus L. (Button Mangrove),
Laguncularia racemosa (L.) Gaertn (White Mangrove), and Rhizophora mangle
L. (Red Mangrove) (Reimold 1977). This southernmost site was included because
it also contains 19 of the 46 vascular salt marsh plants included in this study
and likely represents a transition zone between more southern mangrove swamps
and the more northern salt marshes.
The specific objectives of this study were: 1) to visualize if the salt
marsh plant community changed along a latitudinal gradient; 2) to trace cooccurrence
of species and the groupings of sites; 3) to ascertain if any of the
vascular salt marsh plants were unique to specific sites, and for those that
were not, the extent of their range; and 4) to compare the results of parsimony
analysis with those of multivariate methods more commonly used to evaluate
and ordinate communities (e.g., hierarchical cluster analysis and non-metric
multidimensional scaling).
Methods
The data for this study came from a series of floristic survey studies, based
on multiple site visits during the growing seasons of salt marsh vegetation,
and published between 1972 and 2006. These studies do not represent quantitative
ecological inventory analyses. Each published paper represents an
exhaustive floristic survey based on the results of at least three years of coverage
of a site over all regional growing seasons, in which the entire habitat was
walked and the presence of species recorded. At least one voucher specimen
of each species found was taken for herbarium deposition in the A.C. Moore
Herbarium, University of South Carolina, Columbia, SC. Table 1 lists the 20
sites included in this study, their latitudes, and their specific reference source.
We carefully examined each one of these published papers to vet the site-bysite
presence of the vascular salt marsh plants included in this study, leaving
out Zostera marina L. (Common Eelgrass) and other coastal submerged
vegetation that were sometimes included in the floristic data for these sites.
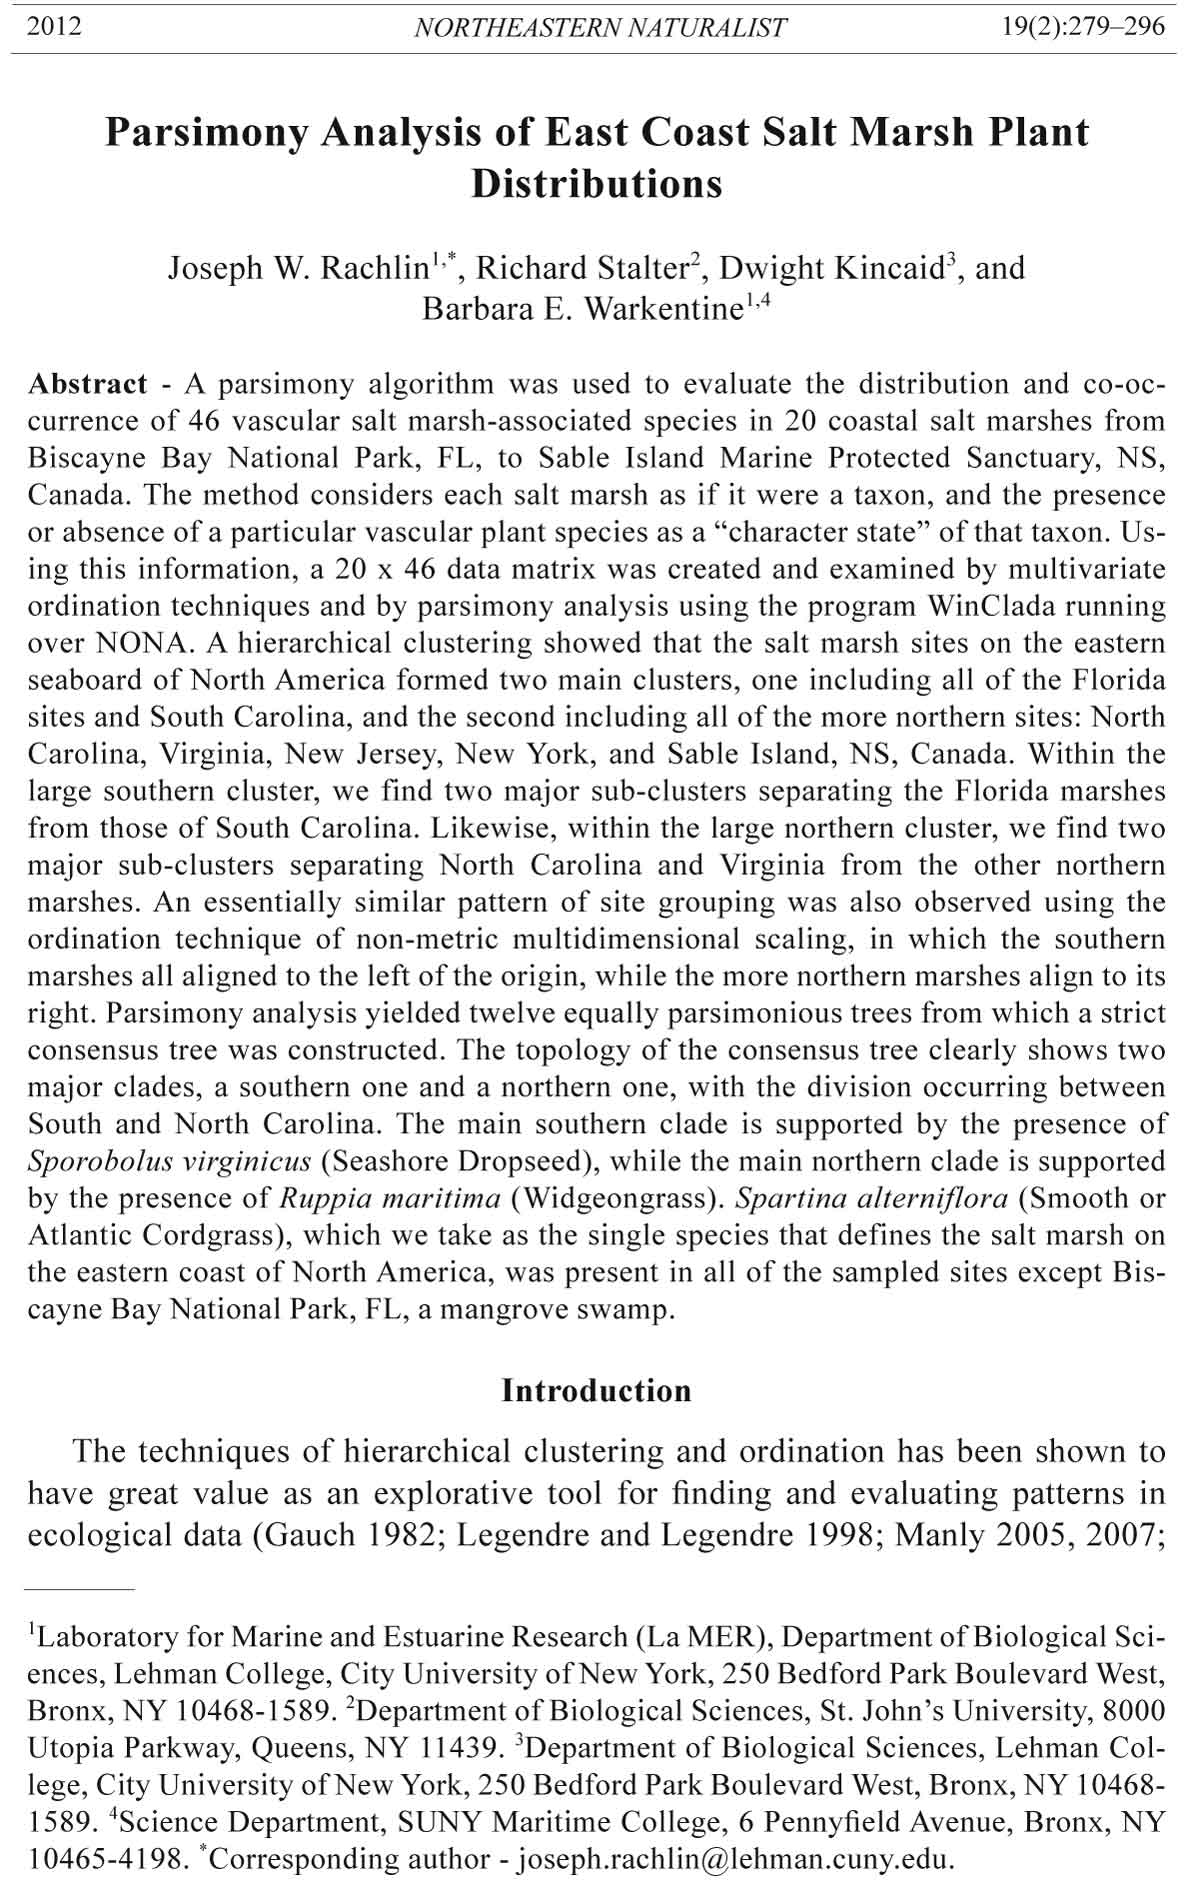
Table 1 also lists the site codes used throughout the analyses. Figure 1, a map
of the east coast of the United States from Florida north to Connecticut, shows
the approximate locations of 19 of the 20 marshes evaluated in this study. The
20th salt marsh, Sable Island, NS, Canada, at a latitude of 43°56'N, is approximately
168 nautical miles north of the northernmost US site (Orient Beach
State Park, NY) and is shown as an insert in Figure 1.
Because plant nomenclature has changed over the 34 years encompassed by
this study, the problem of synonyms was dealt with in the following manner.
Species in South Carolina originally classified after Radford et al. (1971), species
from North Carolina to New York originally classified after Gleason and
Cronquist (1991), and species from Florida originally classified after Wunderlin
282 Northeastern Naturalist Vol. 19, No. 2
(1998), are now classified for consistency according to Kartesz (1994). Genus
and species names were then checked with the large Integrated Taxonomic Information
System Database (ITIS 2011).
All taxa were identified to species and recorded by salt marsh study site. A 20-
site by 46-species data matrix was constructed (Table 2a) in which the presence
of a species at a particular site was coded as “1” and its absence coded as “0”. In
this coding, we treat each site as if it were a “taxon” and the presence/absence of
a plant species as a character state of that “taxon” (Lambshead and Paterson 1986,
Rachlin et al. 2008, Wenzel and Luque 2008). Table 2b lists the codes for each of
the 46 plant species examined in this study along with their naming authorities.
This data matrix was analyzed by two multivariate techniques, hierarchical cluster
analysis, and the ordination technique of non-metric multidimensional scaling. In
addition to the many other possible methods of analysis, we also did not include
indicator species analysis (De Caceres and Legendre 2009, Dufrene and Legendre
1997) as this technique did not seem suitable for our data and for our objectives.
Further, it was our desire to conduct all of the analyses using proven non-commercial
software packages available online, and the current version of PAST used
for the multivariate analysis part of this paper does not support indicator species
analysis. It is supported as an R language package, but using it as such requires
familiarity and experience with the R language, not yet a common achievement
among investigators.
Table 1. Salt marsh sites, listed from southernmost to northernmost, for parsimony analysis of
species co-occurrence and references to publications from which the site specific species data was
obtained.
Site # Site name Code Latitude Reference
1 Biscayne Bay National Park, flBNP,fl25°39'N Stalter et al. 1999
2 Turtle Mound, flTM,fl28°55'N Stalter and Kincaid 2004
3 Green Mound, flGM,fl29°06'N Stalter and Kincaid 2004
4 Tomoka State Park, flTSP,fl29°20'N Stalter and Kincaid 2004
5 Turtle Island, SC TI,SC 32°03'N Stalter 1973
6 Hunting Island State Park, SC HISP,SC 32°23'N Stalter 1985
7 Otter Island, SC OI,SC 32°29'N Stalter 1972
8 Isle of Palms, SC IoP,SC 32°48'N Stalter 1975
9 Bull Island, SC BI,SC 32°54'N Stalter 1984
10 Huntington Beach State Park, SC HBSP,SC 33°30'N Stalter 1971, 1978
11 Outer Banks, NC OB,NC 35°46'N Stalter and Lamont 1997
12 Fisherman Island, VA FI,VA 37°05'N Stalter and Lamont 2000a
13 Assateague Island, VA AI,VA 37°55'N Stalter and Lamont 1990
14 Cape May Point State Park, NJ CMSP,NJ 38°56'N Sutton et al. 1990
15 Little Beach Island, NJ LBI,NJ 39°28'N Stalter 1994
16 Sandy Hook, NJ SH,NJ 40°25'N Stalter and Lamont 2000b
17 Jamaica Bay Wildlife Refuge, NY JBWR,NY 40°37'N Stalter and Lamont 2002
18 Fire Island National Sea Shore, NY FINSS,NY 40°39'N Stalter et al. 1986
19 Orient Beach State Park, NY OBSP,NY 41°08'N Lamont and Stalter 1991
20 Sable Island, NS, Canada SI,CAN 43°56'N Stalter and Lamont 2006
2012 J.W. Rachlin, R. Stalter, D. Kincaid, and B.E. Warkentine 283
Non-metric multidimensional scaling is selected as the ordination method
of choice as it is a “free-ordination” technique that attempts to find patterns in
the data in the absence of predetermined guiding principles as to what might
cause these patterns; it also provides a synthesis of the information about the
Figure 1. Map showing approximate locations of the sampled US east coast salt marsh
sites from Florida north to New York, with insert showing Sable Island, NS, Canada. See
Table 1 for site codes.
284 Northeastern Naturalist Vol. 19, No. 2
Table 2a. Data matrix of 20 stations and 46 salt marsh vascular plant species. 0 = species absence at a particular site, and 1 = species presence at a particular
site. Station codes as per Table 1. Species codes listed in Table 2b.
Species
Stations 1 2 3 4 5 6 7 8 9 10 11 12 13 14 15 16 17 18 19 20 21 22 23 24 25 26 27 28 29 30 31 32 33 34 35 36 37 38 39 40 41 42 43 44 45 46
BNP,fl0 0 1 0 0 1 1 0 1 1 1 0 0 1 0 0 0 1 1 0 0 0 1 1 0 0 0 1 0 0 1 0 1 0 0 1 1 1 0 1 0 1 0 1 0 0
TM,fl0 0 0 0 0 1 0 0 0 0 0 1 0 0 0 0 0 1 0 0 0 0 1 0 0 0 0 1 0 0 0 0 0 0 0 0 0 0 1 0 0 1 0 0 0 0
GM,fl0 0 0 0 0 0 0 0 1 1 1 1 0 1 0 0 0 0 0 0 0 0 0 0 0 0 0 1 0 0 0 0 1 0 0 1 0 1 1 1 0 1 0 0 0 0
TSP,fl0 0 0 0 0 0 1 0 1 1 0 1 0 1 0 0 0 0 0 0 0 0 0 0 0 0 0 0 0 0 0 0 0 0 0 0 0 1 1 1 0 1 0 0 0 0
TI,SC 0 0 1 0 0 0 1 0 1 1 0 0 0 1 0 0 0 0 0 1 0 1 0 1 0 0 0 0 0 1 0 1 1 0 0 0 0 0 1 1 0 1 0 1 0 0
HISP,SC 0 0 1 1 1 0 1 0 1 1 0 0 1 1 0 0 0 0 1 1 0 1 0 1 1 0 0 0 0 1 1 0 1 0 1 0 0 1 1 1 0 1 0 1 0 0
OI,SC 0 0 1 1 0 0 1 0 1 1 0 0 1 1 0 0 0 0 0 1 0 1 0 1 0 0 0 0 0 1 0 1 1 0 0 0 0 1 1 1 0 1 0 1 0 0
IoP,SC 0 1 1 1 1 0 1 0 0 1 0 0 0 1 0 0 0 0 1 1 0 1 0 1 1 0 0 0 0 1 1 0 1 1 0 0 1 1 1 1 1 1 0 1 0 0
BI,SC 0 1 1 0 1 0 1 0 1 1 0 0 1 1 0 0 0 0 1 1 0 1 0 1 1 0 0 0 0 0 1 0 1 0 1 0 0 1 1 1 0 1 0 1 0 0
HBSP,SC 0 0 1 1 1 0 1 0 0 0 0 0 0 0 0 0 0 0 0 1 0 1 0 1 0 0 0 0 0 1 0 0 1 0 0 0 1 1 1 1 0 1 0 1 0 0
OB,NC 1 1 1 1 1 0 0 0 0 1 0 1 0 1 1 1 1 0 1 1 0 1 0 1 0 0 0 0 1 1 1 1 1 1 1 1 0 1 1 1 1 0 0 1 0 0
FI,VA 1 1 1 1 1 0 0 0 0 1 0 0 0 1 0 1 1 0 0 1 1 1 0 1 0 0 0 0 0 1 1 1 1 1 1 1 0 1 1 1 0 0 1 1 0 0
AI,VA 1 1 1 1 1 0 0 1 0 1 0 0 0 1 1 1 1 0 0 1 1 1 0 1 0 0 0 0 1 1 1 1 1 1 0 1 0 1 1 1 1 0 0 1 0 0
CMPSP,NJ 0 1 0 0 1 0 0 0 0 0 0 0 0 1 0 0 0 0 0 0 1 0 0 0 0 0 1 0 1 1 0 0 0 1 1 0 0 1 1 1 1 0 0 0 0 0
LBI,NJ 0 0 1 1 1 0 0 1 0 0 0 0 0 1 0 0 0 0 0 1 1 0 0 1 0 1 0 0 1 1 0 1 1 0 1 1 0 1 1 1 1 0 0 1 0 0
SH,NJ 0 0 1 1 1 0 0 1 0 0 0 0 0 1 0 0 0 0 0 1 1 0 0 1 0 1 0 0 1 0 0 1 1 0 0 0 0 1 1 1 1 0 1 1 0 0
JBWR,NY 0 1 1 1 1 0 0 1 0 0 0 0 0 1 1 1 0 0 0 1 1 0 0 1 0 0 0 0 0 1 0 1 0 1 0 0 0 1 1 1 1 0 1 0 1 0
FINSS,NY 0 0 0 1 1 0 0 1 0 0 0 0 0 1 0 0 0 0 0 1 1 0 0 1 0 0 1 0 0 1 0 1 0 0 1 0 0 1 1 1 0 0 0 0 1 0
OBSP,NY 1 1 1 1 1 0 0 1 0 0 0 0 0 1 0 1 1 0 0 1 1 0 0 1 0 1 0 0 1 1 0 1 1 1 1 0 0 1 1 1 1 0 0 1 1 1
SI,CAN 0 0 0 0 1 0 0 0 0 0 0 0 0 0 1 1 0 0 0 0 0 0 0 0 0 1 0 0 1 0 0 0 0 0 0 0 0 1 1 0 1 0 0 0 0 0
2012 J.W. Rachlin, R. Stalter, D. Kincaid, and B.E. Warkentine 285
Table 2b. Species codes for Table 2a.
Code Species Code Species
1 Agalinis maritima (Raf.) Raf. (Saltmarsh False Foxglove) 28 Rhizophora mangle L. (Red Mangrove)
2 Aster subulatus Michx. (Annual Saltmarsh Aster) 29 Ruppia maritima L. (Widgeongrass)
3 Aster tenuifolius L. (Saline Aster) 30 Sabatia stellaris Pursh (Rose of Plymouth)
4 Atriplex arenaria Nutt. (Quelite) 31 Salicornia bigelovii Torr. (Dwarf Saltwort)
5 Atriplex prostrata Boucher ex DC. (Hastate Orache) 32 Salicornia europaea sensu Wolff & Jefferies, non L. (Slender Glasswort)
6 Avicennia germinans (L.) L. (Black Mangrove) 33 Salicornia virginica L. (Virginia Glasswort)
7 Baccharis angustifolia Michx. (Saltwater False Willow) 34 Scirpus americanus auct. non Pers. (American Bulrush)
8 Bassia hirsuta (L.) Asch. (Hairy Smotherweed) 35 Scirpus robustus Pursh (Sturdy Bulrush)
9 Batis maritima L. (Saltwort) 36 Sesuvium maritimum (Walt.) B.S.P. (Slender Seapurslane)
10 Borrichia frutescens (L.) DC (Bushy Seaoxeye) 37 Sesuvium portulacastrum (L.) L. (Shoreline Seapurslane)
11 Conocarpus erectus L. (Button Mangrove) 38 Solidago sempervirens L. (Seaside Goldenrod)
12 Cynanchum angustifolium Pers. (Gulf Coast Swallowwort) 39 Spartina alterniflora Loisel. (Atlantic Cordgrass)
13 Cynanchum palustre (Pursh) Heller (Gulf Coast Swallowwort) 40 Spartina patens (Aiton) Muhl. (Marshhay Cordgrass)
14 Distichlis spicata (L.) Greene (Desert Saltgrass) 41 Spergularia maritima (All.) Chiov. (Media Sandspurry)
15 Eleocharis halophila (Fernald & Brackett) 42 Sporobolus virginicus (L.) Kunth (Seashore Dropseed)
Fernald & Brackett (Saltmarsh Spikerush) 43 Suaeda calceoliformis (Hook.) Moq. (Paiuteweed)
16 Eleocharis parvula (Roem. & Schult.) Link ex Bluff, 44 Suaeda linearis (Elliott) Moq. (Annual Seepweed)
Nees & Schauer (Dwarf Spikerush); 45 Suaeda maritima (L.) Dumort. (Herbaceous Seepweed)
17 Fimbristylis castanea (Michx.) Vahl (Marsh Fimbry) 46 Triglochin maritima L. (Arrowgrass)
18 Heliotropium angiospermum Murr. (Scorpion’s-tail)
19 Heliotropium curassavicum L. (Quail Plant)
20 Iva frutescens L. (Bigleaf Sumpweed)
21 Juncus gerardii Loisel. (Saltmarsh Rush)
22 Juncus roemerianus Scheele (Needlegrass Rush)
23 Laguncularia racemosa (L.) Gaertn. f. (White Mangrove)
24 Limonium carolinianum (Walt.) Britt. (Carolina Sea-lavender)
25 Limonium nashii Small (Carolina Sea-lavender)
26 Plantago maritima L. (Goose Tongue)
27 Puccinellia fasciculata (Torr.) E.P. Bicknell (Saltmarsh Alkaligrass)
286 Northeastern Naturalist Vol. 19, No. 2
similarity of sample units to one another (Gauch 1982, Gerhard et al. 2004,
Hammer and Harper 2006, Manly 2005, McCune and Grace 2002, Peck 2010).
As such it is ideally suited for our data, which comes from a data set based
on floristic collections made over a 34-year time span. Hierarchical cluster
analysis was performed using Ward’s method (Hammer and Harper 2006,
McCune and Grace 2002), and non-metric multidimensional scaling used the
Bray-Curtis measure of similarity (Hammer and Harper 2006). The technique
of non-metric multidimensional scaling is performed by the program such that
each run is actually a sequence of eleven trials from which the one with the
smallest stress is chosen; ten of the trials have random starting configurations,
and the eleventh uses principal coordinate analysis to compute the starting
configuration. The algorithm implemented in PAST to accomplish this is
based on a relatively new approach developed by Taguchi and Oono (2005).
Stress values below 0.1 are considered “good” (Hammer and Harper 2006). In
addition, the Shepard plot of the obtained versus the observed (target) ranks
indicates the quality of the result. Under ideal conditions, all points in the
Shepard plot should fall on a straight ascending line (x = y), the number of
points in the plot for n original data points will be a total of (n2 - n) / 2 (Hammer
and Harper 2006). These multivariate analyses were carried out using the
program PAST version 2.12 (Hammer et al. 2001). This statistical program
in its most recent version can be downloaded at no cost from http://folk.uio.
no/ohammer/past. The parsimony analysis was performed using WinClada
(Nixon 2002) running over NONA (Goloboff 1993) with “slow or Deltran optimization”,
and a null station consisting of all zeros was added to the data set
of Table 2a to root the tree or trees generated in the analysis.
Results
The results of the multivariate techniques are shown in Figures 2, 3, and 4.
The hierarchical cluster analysis (Fig. 2) essentially forms two main clusters
representing a southern section from Florida north to and including South
Carolina, and a northern section from North Carolina to Sable Island Canada.
The southern section is further subdivided into two subsections essentially
separating the Florida marshes from those of South Carolina. The northern
section is likewise essentially divided into two main subdivisions separating
the North Carolina and Virginia marshes from those of New York, New Jersey,
and Canada.
Figure 3 presents the results of non-metric multidimensional scaling (NMDS)
analysis, the multivariate ordination technique used in this study. NMDS provides
a spatial representation of the data suitable for ecological community
analysis (Gauch 1982, Gerhard et al. 2004, Hammer and Harper 2006, Harrison
and Whitfield 2006, McCune and Grace 2002, Peck 2010), and the figure shows
that all of the southern marshes lie to the left of the origin, while the northern
marshes from North Carolina to Canada lie to the right of the origin; axis 1,
2012 J.W. Rachlin, R. Stalter, D. Kincaid, and B.E. Warkentine 287
which is the axis accounting for this separation, had an r2 value of 0.8516. This
separation echoes the major divisions observed in the hierarchical cluster analysis
(Fig. 2). The separation of marshes above and below the origin is weakly
accounted for by axis 2, which had an r2 of only 0.0699. It can also be seen that
all of the Florida sites lie to the left of the South Carolina sites, and the North
Carolina and Virginia sites form a tight cluster on the right side of the origin in
the upper quadrant, indicating similarity in species space. This NMDS ordination
technique transforms the distances between the stations, as defined by their inclusive
species, into ranks, and compares these ranked distances with the ranks of
the distances in the ordination plot. The quality of the result may be determined
by assessing the resulting stress, which is a measure of how much the ranked distance
in the ordination deviate from the original ranked distances (Hammer and
Harper 2006). A stress value of 0.1 is considered good, and our value of 0.09737
Figure 2. Hierarchical cluster analysis, using Ward’s method, of the sampled sites derived
from the data matrix (Table 2a). See Table 1 for site codes.
288 Northeastern Naturalist Vol. 19, No. 2
is thus quite acceptable. Another way of assessing the quality of the NMDS ordination
is to generate a Sheppard plot as shown in Figure 4. This procedure plots
the ranks obtained from the ordination against the original ranks. Ideally, these
values should be the same and produce a linear plot. The number of plotted points
in a Sheppard Plot is (n2 - n) / 2, where “n” equals the number of original data
points (Hammer and Harper 2006). In our case, the number of plotted points is
190 since we are considering the ordination of 20 stations, and the plotted points
do produce an essentially linear plot.
Parsimony analysis yielded 12 equally parsimonious trees, which were collapsed
on the ambiguous nodes to yield the strict consensus tree presented in
Figure 5. We used Deltran or slow optimization, as this tends to push the character
states, in this case salt marsh species, as far up towards the terminal taxa
(sampled sites, coded as per Table 1) as possible. The display of the character
states (species) is represented as either a closed black circle or an open white
circle. A black circle indicates that a particular species is on a branch leading
Figure 3. Non-metric multidimensional scaling analysis of sampled sites derived from the
data matrix (Table 2a). See Table 1 for site codes.
2012 J.W. Rachlin, R. Stalter, D. Kincaid, and B.E. Warkentine 289
to a clade, and that it uniquely supports that clade; further, it is usually found
in all members of that clade. If the black circle is found only on the terminal
branch of the clade, it indicates uniqueness of that salt marsh plant to that site.
Open white circles indicate that the salt marsh species is neither unique to a
particular clade nor uniquely supports a clade. The numbers above the circles
identify the species, and the number below the circle, either a “1” or a “0”, indicates
the presence or absence of that species at that location. For example, in
Figure 5, black circle 39 representing the species Spartina alterniflora, with a
“1” below it, is found on the base branch leading to all of the sites examined,
and is therefore considered the one species common to and defining all salt
marshes studied from Turtle Mound, Florida (TM,FL) to Sable Island, Canada
(SI,CAN). The unique absence of Spartina alterniflora from Biscayne Bay
National Park, Florida (BNP,FL) indicated by a “0” below the open circle numbered
39 on the terminal branch leading directly to this site would indicate that
this site is not a true salt marsh; in fact, it is a mangal. Reading back from the
terminal site, to the base of the tree and noting all of the species represented
with a “1” below the circles, either black or white, indicates the entire assemblage
of salt marsh species at that site.
The first thing that becomes obvious in Figure 5 is that once again there
is a separation into two major clades representing the southern salt marshes
Figure 4. Shepard plot derived from non-metric multidimensional scaling analysis.
290 Northeastern Naturalist Vol. 19, No. 2
and the northern ones, and again the separation occurs in the vicinity of North
Carolina, which aggregates with the northern marshes. The northern clade is
supported by species #29 (Ruppia maritima), which is present at all but three of
Figure 5. Strict consensus tree derived from parsimony analysis of the data matrix (Table
2a). See Table 1 for site codes. Closed black circles represent species either unique to a
site or uniquely supporting a clade of sites. Open circles represent species not unique to
a site or clade. The number “1” below any circle represents the presence of that species,
while a “0” represents its absence. Code numbers above circles represent species that are
identified below the tree.
2012 J.W. Rachlin, R. Stalter, D. Kincaid, and B.E. Warkentine 291
the northern marshes from the Outer Banks, NC (35°46'N) to Sable Island, NS,
Canada (43°56'N); it was absent from Fisherman Island, VA (37°05'N), Jamaica
Bay Wildlife Refuge, NY (40°37'N), and Fire Island National Sea Shore, NY
(40°39'N). Among the northern clades, # 46 (Triglochin maritima [Arrowgrass]),
is unique to Orient Beach State Park, NY. There are no other salt marsh plants
in either the northern or the southern clade that were found in only one of our
study sites. The southern clade is supported by species #42 (Sporobolus virginicus),
which is present in all of the southern marshes including the Biscayne Bay
National Park, FL, a mangal. In addition, species #9 (Batis maritima [Saltwort])
uniquely supports all of the clade after Turtle Mound, FL, but is absent from
Huntington Beach, SC and Isle of Palms, SC, and species number 14 (Distichlis
spicata [Desert Saltgrass]), also supporting the same clade, but not uniquely, is
only absent from Huntington Beach State Park, SC. In fact, from a latitudinal perspective,
Distichlis spicata is present in all of the sampled southern salt marshes
between latitudes 25°39'N (Biscayne Bay NP, FL) and 32°54'N (Bull Island, SC)
except for the Turtle Mound, flsite (28°55'N). It is, however, also found in all
of the northern marshes except for the Sable Island, NS site.
Discussion
In order to understand the distribution and co-occurrence of salt marsh vegetation
along the east coast of North America, we first obtained a relatively large data
set consisting of 20 sites, comprising a total of 46 salt marsh vascular species.
This data set was first examined using the techniques of multivariate analysis
as a means of exploration to determine the existence of any structure in the
data set (Gauch 1982, Legendre and Legendre 1998, Manly 2005, McCune and
Grace 2002, Pielou 1984). The techniques used consisted of hierarchical cluster
analysis and the ordination technique of non-metric multidimensional scaling.
Hierarchical cluster analysis actually groups sites in an evident hierarchy; however,
since it is known that most clustering algorithms result in a hierarchy even
if the elements are not hierarchically related (Legendre and Legendre 1998),
several investigators have used non-metric multidimensional scaling to validate
their results (Gerhard et al. 2004, Harrison and Whitfield 2006, Rachlin et al.
2008). In the current study, the use of PAST version 2.12 (Hammer et al. 2001)
provided modules for both the hierarchical cluster analysis and non-metric multidimensional
scaling with the ability to choose one of several distance measures
to provide output with minimum stress, and the ability to generate a Shepard plot
to further validate the results.
Used in conjunction, hierarchical classification and ordination, because of
their complementary natures, provide a powerful tool in discerning patterns in
the structure of community data (Adam 1978, Brazner and Beals 1997). Figures
2 and 3 clearly show a fairly consistent structure in the aggregation and
clustering of the sites examined in this study. There also is a general north–
south trending which would be anticipated based on the mean temperatures and
292 Northeastern Naturalist Vol. 19, No. 2
tidal and climatic conditions normally experienced on a latitudinal gradient
along the east coast of North America (Adam 1978, Hartig et al. 2002, Pennings
et al. 2005, Pethick 1981). What is of particular interest was the clear
break between southern and northern marshes occurring between Huntington
Beach State Park, SC and the Outer Banks, NC, approximately 426 km distant.
This observation first clearly seen in the hierarchical cluster analysis (Fig. 2)
was also confirmed in the parsimony analysis (Fig. 5), and a closer examination
of Figure 5 clearly shows that there are five species (Agalinis maritima
[Saltmarsh Foxglove], Fimbristylis castanea [Marsh Frimby], Juncus gerardii
[Saltmarsh Rush], Ruppia maritima, and Triglochin maritima) uniquely associated
with the northern marshes, and four species (Baccharis angustifolia (Saltwater
False Willow), Batis maritima, Limonium nashii (Carolina Sea-lavender),
and Sporobolus virginicus) uniquely associated with the southern marshes. Of
further interest is that some species, such as Juncus roemerianus (Needlegrass
Rush), are found in both northern and southern marshes, being present in all of
the South Carolina marshes and also in the North Carolina and Virginia sites,
but the congeneric Juncus gerardii is exclusive to the northern marshes (Fig.
5). This observation is consistent with the earlier distributional report of Eleuterius
(1976). One can also see that Spartina alterniflora is associated with all of
the salt marshes but is absent from Biscayne Bay National Park, FL. This site,
which is included in this study because of the presence of 20 of the 46 other salt
marsh vascular plant species, is actually classified as a mangal rather than a salt
marsh and likely represents a transition zone between the more southern mangrove
marshes and the more northern salt marshes (Reimold 1977).
The parsimony analysis yielded 12 equally parsimonious trees, which
indicated that the data did not have enough resolution to produce a single
unambiguous tree showing a unique hierarchical grouping of all of the sites.
When this occurs, one selects the strict consensus tree option to produce a
single tree collapsed on the ambiguous nodes. An examination of Figure 5
shows that the strict consensus tree is in essential agreement with the results
of the multivariate analyses. While the multivariate analyses showed that
there was indeed structure in the data, the advantage of the parsimony analysis
is that in addition to showing that the data has an ordered structure, one can
graphically visualize the precise nature of that structure by treating the sites
as if they were taxa and the presence of salt marsh plant species as character
states of those taxa. This visual representation permits a direct reading, from
the terminal branch back to the base, of all species present at the terminal site.
Further, one can readily see which salt marsh plant species are unique to a particular
site and which are not, and which grouping of sites share common salt
marsh plants. In other words, the salt marsh vegetation community structure
becomes readily discernable and comparisons among the sites are easily made.
For example, looking at Assateague Island, VA (AI,VA) and reading from the
terminal branch back to the base of the tree we see that this salt marsh contains
a community of twenty-seven species represented by #15 Eleocharis halophila
2012 J.W. Rachlin, R. Stalter, D. Kincaid, and B.E. Warkentine 293
(Saltmarsh Spikerush), #36 Sesuvium maritimum (Slender Seapurslane), #31
Salicornia bigelovii (Dwarf Saltwort), #22 Juncus roemerianus, #10 Borrichia
frutescens (Bushy Seaoxeye), #44 Suaeda linearis (Annual Seepweed), #34
Scirpus americanus (American Bulrush) , #33 Salicornia virginica (Virginia
Glasswort), #17 Fimbristylis castanea, #16 Eleocharis parvula (Dwarf Spicebush),
#2 Aster subulatus (Annual Saltmarsh Aster), #1 Agalinis maritima, #32
Salicornia europaea (Slender Glasswort), #24 Limonium carolinianum (Carolina
Sea-lavender), #20 Iva frutescens (Bigleaf Sumpweed), #8 Bassia hirsuta
(Hairy Smotherweed), #4 Atriplex arenaria, #3 Aster tenuifolius (Saline Aster),
#40 Spartina patens (Marshhay Cordgrass), #30 Sabatia stellaris (Rose
of Plymouth), #21 Juncus gerardii, #14 Distichlis spicata, #41 Spergularia
maritima (Media Sandspurry), #38 Solidago sempervirens (Seaside Goldenrod),
#29 Ruppia maritima, #5 Atriplex prostrata (Hastate Orache), and #39
Spartina alterniflora, but not #35 Scirpus robustus (Sturdy Bulrush), which
has a “0” below it on the topology.
Thus, we believe that the application of parsimony analysis to ecological
data, as previously demonstrated by Lambshead and Paterson (1986), Rachlin
et al. (2008), and Wenzel and Luque (2008), and as shown in this study, is an
appropriate, timely, and valid approach to understanding, in fine detail, the community
structure and species distributions and co-occurrences underlying the
broad relationships implied by multivariate analyses. This parsimony analysis,
which clearly shows the wide or narrow longitudinal distributions of individual
plant species as well as their co-occurrence with other plant species, generally
follows their greater or narrower tolerance to such environmental parameters as
annual rainfall, temperature, and soil types and other edaphic conditions, which
vary on a longitudinal basis along the east coast of the North American continent.
The results of this parsimony analysis sets the stage for future studies to determine
the specific environmental and spatial factors which constrain vascular salt
marsh vegetation community structure and species distributions as elucidated in
this study. It can be seen that the four specific objectives enumerated in the introduction
of this paper have been successfully met.
Literature Cited
Adam, P. 1978. Geographical variation in British Saltmarsh vegetation. Journal of Ecology
66:339–366.
Brazner, J.C., and E.W. Beals. 1997. Patterns in fish assemblages from wetland and beach
habitats in Green Bay, Lake Michigan: A multivariate analysis of abiotic and biotic
forcing factors. Canadian Journal of Fisheries and Aquatic Sciences 54:1743–1761.
De Caceres, M., and P. Legendre. 2009. Associations between species and groups of sites:
Indices and statistical inference. Ecology 90:3566–3574.
Dufrene, M., and P. Legendre. 1997. Species assemblages and indicator species: The
need for a flexible asymmetrical approach. Ecological Monographs 67:345–366.
Eleuterius, L.N. 1976. The distribution of Juncus roemerianus in the salt marshes of
North America. Chesapeake Science 17:289–292
294 Northeastern Naturalist Vol. 19, No. 2
Gauch, H.G., Jr. 1982. Multivariate Analysis in Community Ecology. Cambridge University
Press, New York, NY. 298 pp.
Gerhard, P., R. Moraes, and S. Molander. 2004. Stream fish communities and their associations
to habitat variables in a rain forest reserve in southeastern Brazil. Environmental
Biology of Fishes 71:321–340.
Gleason, H.A., and A. Cronquist. 1991. Manual of Vascular Plants of the Northeastern
United States and Adjacent Canada, 2nd Edition. New York Botanical Garden, New
York, NY. 910 pp.
Goloboff, P.A. 1993. NONA, Version 2, Published by the author, Tucuman, Argentina.
Available online at http://www.cladistics.com. Accessed 14 November 2011.
Hammer, Ø., and D.A.T. Harper. 2006. Paleontological Data Analysis. Blackwell Publishing,
Malden, MA. 351 pp.
Hammer, Ø., D.A.T. Harper, and P.D. Ryan. 2001. PAST: Paleontological Statistics Software
Package for Education and Data Analysis. Palaeontoligica Electronica 4:1–9.
Available online at http://folk.uio.no/ohammer/past. Accessed 14 November 2011.
Harrison, T.D., and A.K. Whitfield. 2006. Estuarine typology and structuring of fish communities
in South Africa. Environmental Biology of Fishes 75:269–293.
Hartig, E.K., V. Gornitz, A. Kolker, F. Mushacke, and D. Fallon. 2002. Anthropogenic
and climate-change impacts on salt marshes of Jamaica Bay, New York City. Wetlands
22:71–89.
Herrera-Vasquez, J., W. Bussing, and F. Villalobos. 2008. Panbiogeographic analysis of
Costa Rican freshwater fishes. Revista de Biologia Tropical (International of Journal
Tropical Biology and Conservation ISSN-0034-7744) 56:165–170.
Integrated Taxonomic Information System (ITIS). 2011. ITIS database. Available online
at http://www.itis.gov. Accessed 14 November 2011.
Kartesz, J.T. 1994. A Synonymized Checklist of the Vascular Flora of the United States,
Canada, and Greenland, 2nd Edition. Vol. 2: Checklist. Timber Press, Inc., Portland
OR. 816 pp.
Lambshead, P.J.D., and G.L.J. Paterson. 1986. Ecological cladistics: An investigation
of numerical cladistics as a method for analyzing ecological data. Journal of Natural
History 20:895–909.
Lamont, E.E., and R. Stalter. 1991. The vascular flora of Orient Beach State Park, Long
Island, New York. Bulletin of the Torrey Botanical Club 118:459–468.
Legendre, P., and L. Legendre. 1998. Numerical Ecology, 2nd (English) Edition. Elsevier
Science, Amsterdam, The Netherlands. 853 pp.
Manly, B.F.J. 2005. Multivariate Statistical Methods: A Primer, 3rd Edition. Chapman and
Hall/CRC, Boca Raton, FL. 214 pp.
Manly, B.F.J. 2007. Randomization, Bootstrap and Monte Carlo Methods in Biology, 3rd
Edition. Chapman and Hall/CRC, Boca Raton, FL. 455 pp.
McCune, B., and J.B. Grace. 2002. Analysis of Ecological Communities. MJM Software
Design, Gleneden Beach, OR. 300 pp.
Nixon, K.C. 2002. WinClada, Version 1.00.08. Published by the author, Ithaca, NY.
Available online at http://www.cladistics.com. Accessed 14 November 2010.
Peck, J.E. 2010. Mutivariate Analysis for Community Ecologists: Step-by-Step using
PC-ORD. MJM Software Design, Gleneden Beach, OR. 162 pp.
Pennings, S.C., M-B. Grant, and M.D. Bertness. 2005. Plant zonation in low-latitude
salt marshes: Disentangling the roles of flooding, salinity, and competition. Journal
of Ecology 93:159–167.
2012 J.W. Rachlin, R. Stalter, D. Kincaid, and B.E. Warkentine 295
Pethick, J.S. 1981. Long-term accretion rates on tidal salt marshes. Journal of Sedimentary
Petrology 51:571–577.
Pielou, E.C. 1984. The Interpretation of Ecological Data: A Primer on Classification and
Ordination. John Wiley and Sons, New York, NY. 263 pp.
Rachlin, J.W., B.E. Warkentine, and A. Pappantoniou. 2008. Use of a parsimony algorithm
as a method for evaluating ichthyofaunal distribution and co-occurrence in an
urban stream. Journal of Freshwater Ecology 23:1–11.
Radford, A.E., H.E. Ahles, and C.R. Bell. 1971. Manual of the Vascular Flora of the Carolinas.
2nd Edition. University of North Carolina Press, Chapel Hill, NC. 1183 pp.
Reimold, R.J. 1977. Mangals and salt marshes of the eastern United States. Pp. 157–166,
In V.J. Chapman (Ed.). Ecosystems of the World 1: Wet Coastal Ecosystems. Elsevier
Scientific Publishing Co., New York, NY. 428 pp.
Stalter, R. 1971. The summer and fall flora of Huntington Beach State Park Georgetown
County, South Carolina. Castanea 36:167–174.
Stalter, R. 1972. The flora of outer Otter Island, Colleton County, South Carolina. Castanea
37:298–300.
Stalter, R. 1973. The flora of Turtle Island, Jasper Co., South Carolina. Castanea 38:35–37.
Stalter, R. 1975. The flora of the Isle of Palms, South Carolina. Castanea 40:4–13.
Stalter, R. 1978. The plant communities of South Carolina’s barrier islands. Pp. 227–244,
In R.R. Lewis and D.P. Cole (Eds.). Proceedings of the Fifth Annual Conference on
the Restoration of Coastal Vegetation in Florida. Hillsboro County Community College,
Tampa, FL.
Stalter, R. 1984. The flora of Bull Island, Charleston County, South Carolina. Bartonia
50:27–30.
Stalter, R. 1985. The flora of Hunting Island, Beaufort County, South Carolina. Bartonia
51:99–104.
Stalter, R. 1994. The vegetation of Little Beach Island, New Jersey. Bartonia 58:97–100.
Stalter, R., and D. Kincaid. 2004. The vascular flora of five Florida shell middens. Journal
of the Torrey Botanical Society 131:93–103.
Stalter, R., and E.E. Lamont. 1990. The vascular flora of Assateague Island, Virginia.
Bulletin of the Torrey Botanical Club 117:48–56.
Stalter, R., and E.E. Lamont. 1997. Flora of North Carolina’s Outer Banks, Ocracoke
Island to Virginia. Journal of the Torrey Botanical Society 124:71–88.
Stalter, R., and E.E. Lamont. 2000a. Vascular flora of Fisherman Island, Virginia. Journal
of the Torrey Botanical Society 127:324–332.
Stalter, R., and E.E. Lamont. 2000b. Vascular flora of Sandy Hook, New Jersey. Bartonia
60:105–116.
Stalter, R., and E.E. Lamont. 2002. Vascular flora of Jamaica Bay Wildlife Refuge, Long
Island, New York. Journal of the Torrey Botanical Society 129:346–358.
Stalter, R., and E.E. Lamont. 2006. The historical and extant flora of Sable Island, Nova
Scotia, Canada. Journal of the Torrey Botanical Society 133:362–374.
Stalter, R., E.E. Lamont, and J. Northrup. 1986. Vegetation of Fire Island, New York.
Bulletin of the Torrey Boanical Club 113:298–306.
Stalter, R., J. Tamory, P. Lynch, and B. Lockwood. 1999. The vascular flora of Biscayne
National Park, Florida. Sida, Contribtions to Botany 18:1207–1226.
Sutton, P., R. Meyer, and R. Stalter. 1990. The vascular plants of Cape May Point
State Park Cape May County, New Jersey. Bulletin of the Torrey Botanical Club
117:294–300.
296 Northeastern Naturalist Vol. 19, No. 2
Taguchi, Y.-h., and Y. Oono. 2005. Relational patterns of gene expression via non-metric
multidimensional scaling analysis. Bioinformatics 21:730–740.
Wenzel, J.W., and G.M. Luque. 2008. Parsimony analysis of ecological succession, a
powerful tool for interpreting changes in community structure. Cladistics 24:746–
757.
Wunderlin, R. 1998. Guide to the Vascular Plants of Florida. University Press of Florida,
Gainesville, FL. 806 pp.