Possible Effect of Lock and Dam 19 on Phytoplankton
Communities of the Upper Mississippi River
Susan T. Meiers, Sean E. Jenkins, and Richard V. Anderson
Northeastern Naturalist, Volume 15, Issue 3 (2008): 391–402
Full-text pdf (Accessible only to subscribers.To subscribe click here.)
Access Journal Content
Open access browsing of table of contents and abstract pages. Full text pdfs available for download for subscribers.
Current Issue: Vol. 30 (3)

Check out NENA's latest Monograph:
Monograph 22


2008 NORTHEASTERN NATURALIST 15(3):391–402
Possible Effect of Lock and Dam 19 on Phytoplankton
Communities of the Upper Mississippi River
Susan T. Meiers1,*, Sean E. Jenkins1, and Richard V. Anderson1
Abstract - Algal community composition at three sites above and five sites below
Lock and Dam 19 on the upper Mississippi River was determined from samples taken
during July, August, September, and November of 2003, and April and June of 2004,
to compare the above-dam navigation-channel and vegetation-bed phytoplankton
communities, and determine what effect the power plant and lock and dam may have
on the mixing of these communities. We predicted there would be clear differences
in community composition and abundance between the three above-dam locations
and a more uniform community composition below the dam due to mixing. No sitespecific or predictable patterns to suggest an effect of the power plant or lock and
dam were detected. Nonmetric multidimensional scaling ordination supports the idea
that temporal factors may play a larger role in structuring localized phytoplankton
communities in this section of the upper Mississippi River.
Introduction
Over the last century, much of the upper Mississippi River was leveed
and channelized, creating a system of locks and dams to improve commercial
navigation (USGS 1999). These actions, along with agricultural,
municipal, and industrial runoff, and the dredging of barge channels, have
greatly contributed to the continued alteration of associated aquatic and riparian
communities within the river system. The locks and dams and other
structures, such as power plants, have changed the river from a free-flowing
river to a system comprised of a series of pools that in some sections may
be viewed as more lacustrine in nature, with accompanying changes in all
trophic levels within the ecosystem (Fremling 2005).
Few studies have explicitly examined the effect of locks and
navigation dams on the composition and dynamics of phytoplankton
communities in rivers. Reinhard (1931) examined the plankton abundance
and seasonal distribution in the upper Mississippi River from
Minneapolis, MN, to Winona, MN, but did not specifically examine
how the several locks and dams may have affected their abundance or
composition. Wehr and Thorp (1997) observed that Ohio River navigation
dams had less effect on phytoplankton communities than did water
chemistry, and observed no clear general pattern for the effect of dams on
phytoplankton communities. They did suggest that even small changes,
such as a decrease in current velocity, may cause benthic algae to settle
out from the water column above the dam. While these changes may have
1 Western Illinois University, Department of Biological Sciences, 1 University Circle,
Macomb, IL 61455. *Corresponding author - st-meiers@wiu.edu.
392 Northeastern Naturalist Vol. 15, No. 3
negligible effects on the total phytoplankton community, they may affect
the distribution of benthic species above dams more than at other sites.
A number of studies have examined phytoplankton in various reaches
and habitats along the upper Mississippi River. Reinhard (1931) studied a
number of sites in Pools 7 and 9, and observed only negligible differences in
species composition above and below Lake Pepin. Baker and Baker (1979,
1981) studied phytoplankton in the main channel near Prairie Island, MN,
but observed few differences in abundance or community composition
among sites. Huff (1986) examined two main channel and two backwater
sites above Lock and Dam 7 and demonstrated that main channel sites had
greater total biomass during September and that diatoms were the most
common algal group at all sites. Diatoms and cyanbacteria were the most
common algae in main channel sites and were more abundant in these
habitats than in backwater sites. In a study of mid-reach Pool 8, Lange and
Rada (1993) observed no differences in community composition or biomass
among a side channel, an embayment, and shallow marshy habitats, and
attributed this homogeneity to abnormally high river discharge during the
1986 sampling. They also observed that diatoms were the most abundant
group at all locations, reaching a maximum during summer, with Chlorophyta
and cyanobacteria the next most abundant groups.
The present study was conducted above and below Lock and Dam 19
on the upper Mississippi River adjacent to Keokuk, IA. Pool 19, above the
lock and dam, has a diversity of aquatic habitats including main/navigation
channel, main channel border, tailwaters, side channels, rivers, and sloughs
(Jahn and Anderson 1986). An examination of phytoplankton communities
from the (navigation) channel, vegetation bed, and side channel sites of
Pool 19 demonstrated an abundance of pennate diatoms and Euglena sp. in
vegetated sites as opposed to non-vegetated sites (Engman 1984). This study
also revealed that the navigation channel had lower numbers of algae than
sites where vegetation beds and wing dams are located.
Lock and Dam 19 at Keokuk, IA, was completed in 1913 and the pooled
water created Pool 19. The approximately 12-m drop in elevation allows
water to generate power in the Keokuk Power Plant, which also regulates
water level in the pool using a series of gates. Rock wing dams, located just
below the dam, direct most of the flow into the navigation channel located
on the Iowa side of the river (Jahn and Anderson 1986).
In order to better understand the phytoplankton communities of lower
Pool 19 and the effects that pool management are having on these communities,
we compared the abundance and species composition of phytoplankton
communities in the swift-flowing navigation channel and slow-flowing vegetation
bed above Lock and Dam 19, and at sites below the dam. Spatial and
temporal comparisons of these sites were used to determine if phytoplankton
communities varied: 1) between the navigation channel and the middle of
the vegetation bed above the dam; and 2) above and below the power plant
and dam, to determine the extent of mixing of phytoplankton communities
2008 S.T. Meiers, S.E. Jenkins, and R.V. Anderson 393
through the power plant and over the dam. We predicted there would be
clear differences in community composition and abundance between the two
above-dam locations and a more uniform community composition below the
dam due to mixing.
Materials and Methods
Sampling sites
Above-dam sampling sites were chosen to compare two distinct habitats
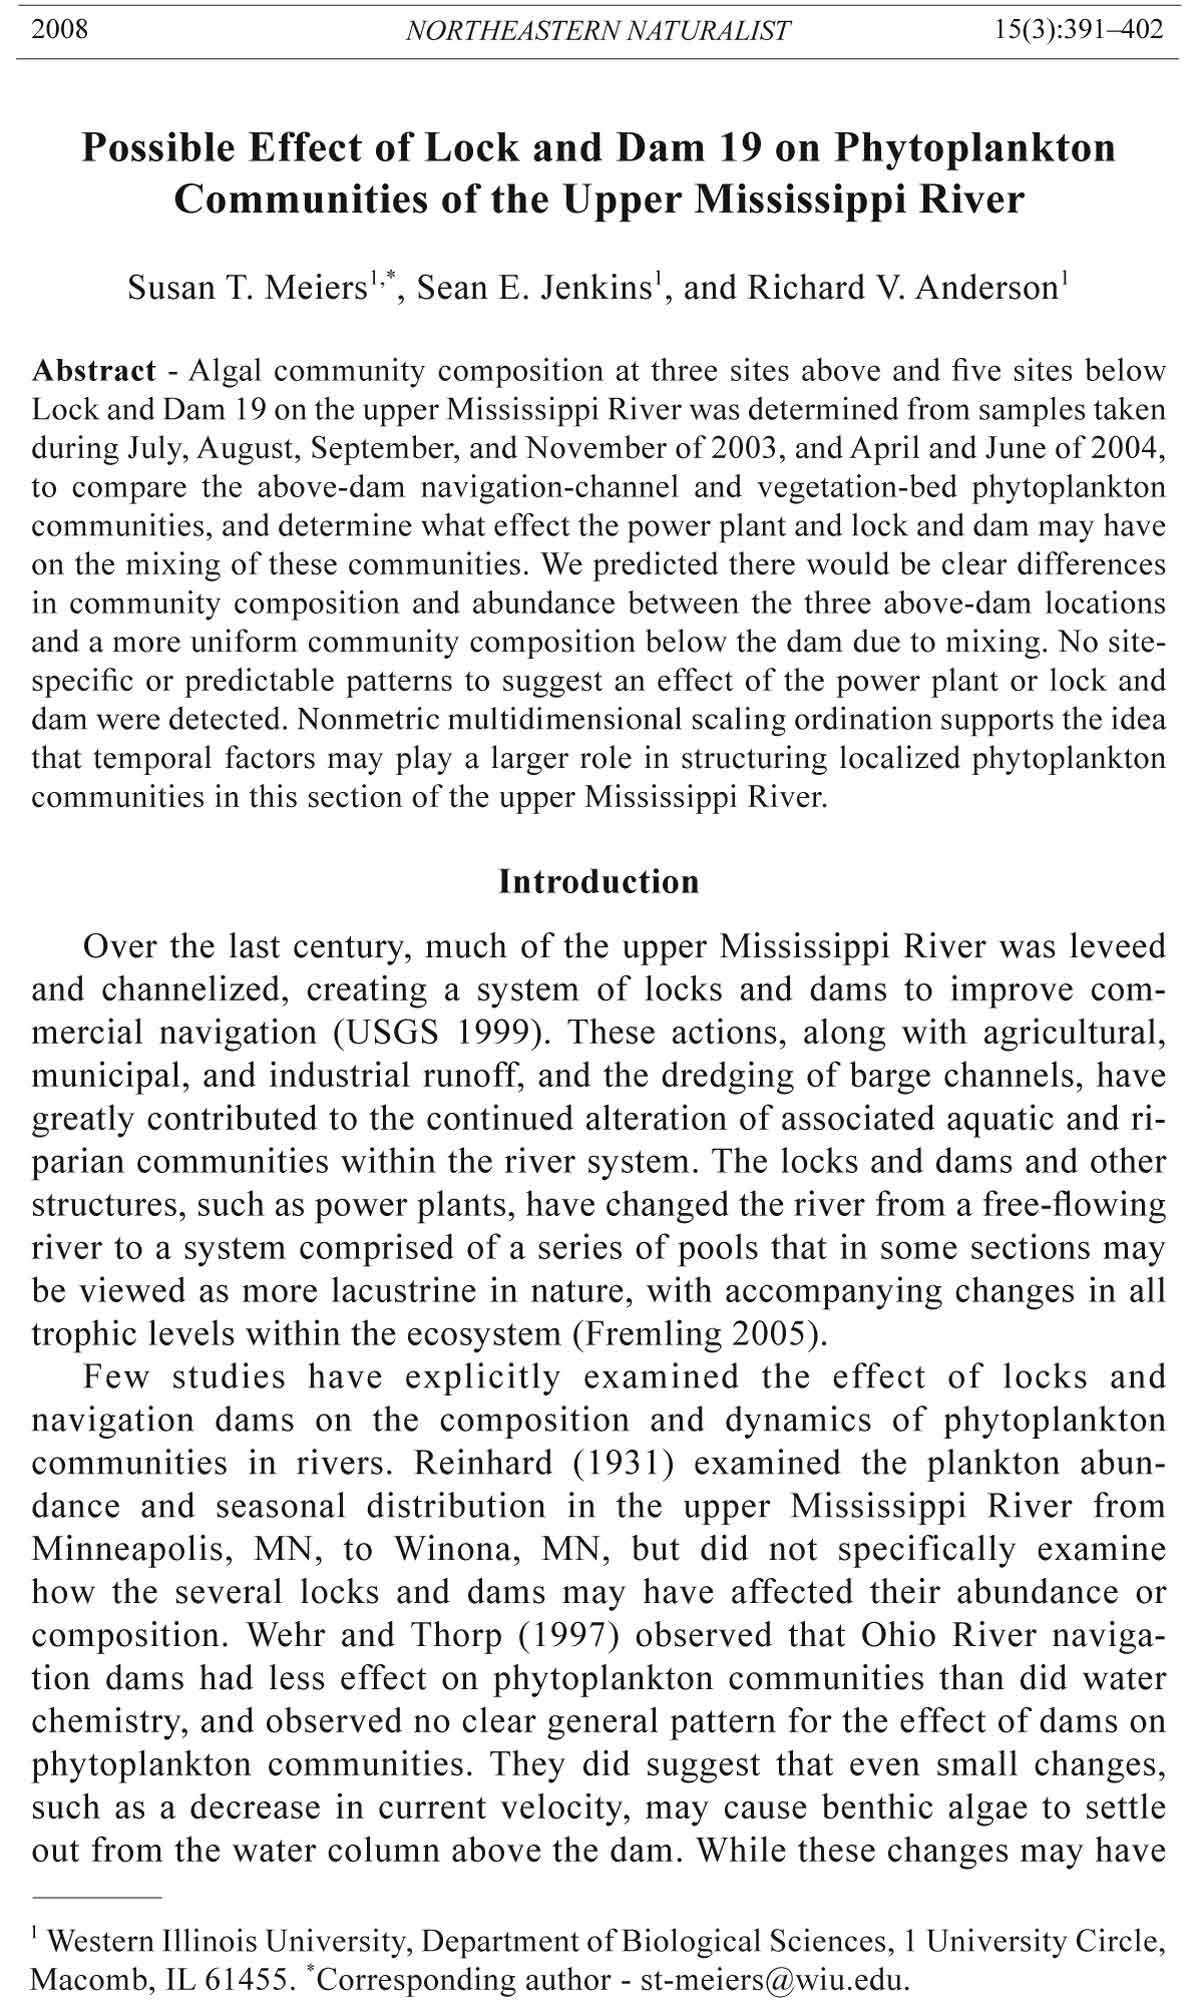
above Lock and Dam 19 (Fig. 1): 1) the navigation channel (Site 1), distinguished
by greater (9 m) depth and faster flowing water, and 2) the middle
of a dense vegetation bed (Site 3) directly east of Site 1, distinguished by
shallow and slower-flowing water. Vallisneria americana Michx. (Water
Celery), Stuckenia pectinata (L.) Böerner (Sago Pondweed), Nelumbo lutea
Willd. (American lotus), Elodea canadensis Michx. (Waterweed or American
Elodea), Potamogeton crispus L. (Curly Pondweed), Potamogeton
nodosus Poir. (American Pondweed), Ceratophyllum demersum L. (Coontail),
and Myriophyllum L. spp. (Water Milfoil) were common macrophyte
species. Site 2, midway between Sites 1 and 3 at the edge of the vegetation
bed, was sampled to address potential above-dam interaction. Three sites
Figure 1. Map of research site with collecting sites (Sites 1–8 as “S1”, “S2”, etc.),
power plant intake pipe (“I”), and power plant outlet or discharge pipe (“O”) indicated
in relation to Keokuk, IA and Hamilton, IL.
394 Northeastern Naturalist Vol. 15, No. 3
directly below the dam were chosen as the most likely to detect if mixing
of navigation channel and vegetation bed communities occurred: Site 4 was
located directly below where the power plant releases its discharge, Site 6
was located in the dam tailwaters, and Site 5 was midway between Sites 4
and 6. Two further sites, approximately 0.3 km downriver, were chosen as
well-mixed since exiting the power plant: Site 7 was in the middle of the
navigation channel and Site 8 in an unvegetated channel border dike field.
Samples were collected above and below Lock and Dam 19 during the
third week of the following months: July and August 2003 (summer), September
and November 2003 (fall), and April and June 2004 (spring). Winter
samples (December through February) were not collected due to the presence
of ice on the river.
Field sampling
Surface light levels (Extech Instruments Model 40123 light meter), current
velocity (Global Flow Probe, Model FP101), water temperature, and
water transparency (Secchi depth) were measured when phytoplankton were
collected at each site, except where unsafe water conditions prevented it
(Table 1). Surface phytoplankton samples were collected to reflect the water
taken into the power plant intake pipe and the water which flows through
open dam gates. All samples were preserved in 1% Lugol’s solution and
returned to the laboratory.
Lab processing
For identification and enumeration, sample bottles were mixed well, 1.0
mL was placed in a Sedgwick-Rafter counting chamber using a Henson-
Stemple pipette, and the cells allowed to settle for 20 min. Identification and
counts were performed using strip counts from four random strips the width
of a Whipple grid at 200x (Clescerl et al. 1999). All individuals, colonies,
and filaments that were more than halfway into the grid were counted. Colonies,
coenobia, and individuals of species that normally occur as multiple
cells were counted as single units; filaments and chains of cells were counted
only when 10 or more cells were present (Clescerl et al. 1999).
Statistical analyses
Nonmetric multidimensional scaling (NMS; Kruskal 1964) was used to
compare phytoplankton composition among sampling sites and dates using
PC-ORD Multivariate Analysis of Ecological Data version 4.25 (McCune and
Grace 2002, McCune and Metford 1999); this method is especially useful with
non-normal data having many zeros (Clarke 1993). The slow-and-thorough
mode with a random starting configuration of NMS was used with the best of 40
runs on real data with a random starting configuration. Monte Carlo simulations
with 50 runs of randomized data were conducted to assess the probability of the
actual configuration. The proportion of the variance explained by each axis was
determined utilizing r2 values between the ordination space and the original
2008 S.T. Meiers, S.E. Jenkins, and R.V. Anderson 395
Table 1. Table of water temperature, light intensity, current velocity, and Secchi depth measurements
of each site. N/A = water level was too high and current was too fast to take physical
measurements on this day.
Water Current Secchi Light
Month/site temp (°C) velocity (m/s) depth (m) intensity (klux)
July 2003 109.7
Site 1 27 7.0 0.46
Site 2 26 2.5 0.05
Site 3 27 0.25 0.38
Site 4 26 9.5 N/A
Site 5 26 17.5 N/A
Site 6 26 18.5 N/A
Site 7 26 15.5 N/A
Site 8 26 5.5 N/A
August 2003 40.6
Site 1 27 2.0 0.53
Site 2 27 0.5 0.70
Site 3 26 0.0 +0.60A
Site 4 27 10.5 N/A
Site 5 27 11.5 N/A
Site 6 N/A N/A N/A
Site 7 27 8.5 N/A
Site 8 27 1 0.8
September 2003 75.6
Site 1 N/A 3.5 0.62
Site 2 N/A 3.0 0.40
Site 3 N/A 1.0 0.52
Site 4 N/A N/A 0.47
Site 5 N/A 11.0 N/A
Site 6 N/A 13.5 N/A
Site 7 N/A 14.0 N/A
Site 8 N/A 13.0 N/A
November 2003 107 .0
Site 1 6 4.2 0.72
Site 2 6 3.2 0.50
Site 3 5 3.2 0.31
Site 4 5 9.0 N/A
Site 5 5 5.0 N/A
Site 6 6 1.5 0.50
Site 7 6 4.5 0.50
Site 8 6 N/A N/A
April 2004 36.0
Site 1 15 5.0 0.64
Site 2 15 4.0 0.60
Site 3 15 4.5 0.40
Site 4 15 8.6 0.45
Site 5 16 5.0 0.50
Site 6 15 3.0 N/A
Site 7 16 5.0 0.46
Site 8 15 9.5 0.60
June 2004 26.0
Site 1 21 N/A N/A
Site 2 22 N/A 0.41
Site 3 21 N/A 0.20
Site 4 22 N/A N/A
Site 5 N/A N/A N/A
Site 6 N/A N/A N/A
Site 7 N/A N/A N/A
Site 8 N/A N/A N/A
ASecchi disk was still visible resting on the bottom sediment.
396 Northeastern Naturalist Vol. 15, No. 3
space distance (McCune and Metford 1999). To test for significant differences
in algal abundances among sites (data non-normal), Kruskal-Wallis tests were
performed on: a) cells/mL per site, b) number of taxa, and c) the total number of
cells/mL for the 15 most abundant taxa.
A one-way Friedman test on ranks was used to compare Simpson’s
diversity values and sampling sites (repeated measures basis) among
dates. Spearman’s rank correlations were performed to examine possible
relationships between Simpson’s diversity values and date, site, and physical
variables. Due to an inability to record very high current velocities,
flow rates were ranked as: 1 = no flow, 2 = low flow, 3 = medium flow, and
4 = too high to measure.
Results
The 254 algal taxa identified were composed of 228 species, 21 varieties,
one centric diatom category, and four unidentified categories
(eukaryotic unicells, pennate diatoms, eukaryotic filaments, and cyanobacterial
filaments). Diatoms and Chlorophytes were the most abundant
taxa at most sites. No significant differences were observed for phytoplankton
densities (cells/mL) among sites or over time (Fig. 2), and no
significant differences were observed for the number of taxa per site or
among dates (Fig. 2). Similarly, Simpson’s diversity indices also were not
significantly different among sites (Fig. 3). Algal densities within each
division (Table 2) indicate that Chlorophytes were most abundant at most
sites, except Site 8, where diatoms were more common. The Simpson’s
diversity indices for each month are presented in Figure 3.
The Monte Carlo randomization test indicated that the NMS ordination
was best fit using a two-axis solution (P < 0.05; Fig. 4). The initial NMS ordination
indicated that two samples were outliers: Site 3 in July 2003 and Site
1 in August 2003. These two samples were removed before the final NMS
analysis. The first two ordination axes accounted for 71.2% of the variability
in the data (Axis 1 = 63.7%, Axis 2 = 23.9%), with a final stress and instability
of 4.01 and 0.00001, respectively. Axis 1 of NMS ordination indicated
Table 2. Total number of cells/mL per site, sorted by division, for sites above (Sites 1-3) and
below (Sites 4-8) Lock and Dam 19.
Number of cells/mL/site
Division Site 1 Site 2 Site 3 Site 4 Site 5 Site 6 Site 7 Site 8
Chlorophyta 64,407.7 68,720.4 84,971.6 64,765.8 87,135.4 58,005.7 89,567.9 12,540.0
Cryptophyta 14.9 14.9 0.0 44.8 0.0 0.0 0.0 14.9
Cyanobacteria 1984.8 1537.1 1357.9 10863.9 1283.4 820.8 1343.1 1328.2
Dinophyta 0.0 14.9 0.0 0.0 0.0 0.0 0.0 14.9
Euglenophyta 313.4 164.2 104.5 74.6 208.9 89.5 343.2 298.5
Ochrophyta
Diatoms 49,887.6 22,429.3 18,862.7 27,667.2 23,384.3 18,698.5 27,010.6 28,935.7
Other 298.5 119.4 119.4 208.9 134.3 74.6 89.5 149.2
Unknown 223.9 44.8 56.7 44.8 14.9 0.0 0.0 14.9
Note: 0= less than 14.9 cells/mL
2008 S.T. Meiers, S.E. Jenkins, and R.V. Anderson 397
marked compositional differences between September, April, and the other
dates (Fig. 4). In September there was an increase of two orders of magnitude
in densities of Chlamydomonas sp., a flagellated green alga. A number of
taxa were found only during that same sample period, including Cosmarium
Figure 2. Mean +1 SE for number of cells/mL, mean number of taxa, and Simpson’s
diversity index for Sites 1 through 8 (abbreviated “S1,” “S2,” etc.) at Lock and Dam
19 on the Mississippi River. Sites 1–3 were above-dam sites, and Sites 4–8 were
below-dam sites.
398 Northeastern Naturalist Vol. 15, No. 3
Figure 3. Mean
+ 1 SE for Simpson’s
diversity
indices for July,
August, September,
and November
2003, and
April and June
2004.
Figure 4. Results of nonmetric multidimensional scaling (NMS) ordination analyses
of phytoplankton communities grouped by species.
2008 S.T. Meiers, S.E. Jenkins, and R.V. Anderson 399
subcrenatum Hantzsch., Tetraedron trigonum (Naegeli) Hansgirg, Surirella
sp., and Aphanizomenon flos-aquae (L.) Ralfs. Echinosphaerella limnetica
G.M. Smith and Micractinium sp. were also common at several sites during
September. The ordination further indicated that April sites were tightly
grouped, and all contained several unique taxa, including Closterium gracile
Brebisson, Cocconeis placentula Ehrenberg, Dictyosphaerium pulchellum
Wood, Rhoicosphenia curvata (Kuetzing) Grunow, and Synedra ulna (Nitz.)
Ehrenberg. The April and September samples had the highest average species
richness with values of 49 and 45, respectively. Most sites in November 2003
clustered close together, except Site 7, which clustered more closely with the
July 2003 and June 2004 sites. Characteristic taxa for most sites on this sample
date were Epithemia ocellata (Ehrenberg) Kuetzing and Eunotia pectinalis
(Kuetzing) Rabenhorst. November had the third-highest average species richness
with a value of 28. Even though on this date the third-highest average
diversity was observed, there were few species unique only to this sampling
date. The composition of July 2003 and June 2004 sites were indistinguishable
by NMS. July 2003 and June 2004 sample sites also had very similar species
composition, with roughly 23 species identified from each. The August samples
were closely grouped in the lower left corner of the ordination, having
the fewest number of centric diatoms as compared with all other sample sites
and dates. These three sampling dates had much lower total abundances and
species richness than November, September, and April samples, though these
differences were not significant.
A one-way Friedman test indicated a significant difference in Simpson’s
diversity among dates (P < 0.001; Fig. 2). Species diversity values for communities
from September and April were significantly different from all
other dates, and from each other (P < 0.001). The correlations with environmental
variables indicated that algal diversity decreased with time (r =
-0.599, P = 0.00001) and was positively related to temperature (r = 0.402,
P = 0.006) and velocity (r = 0.357, P = 0.015).
Discussion
No clear or predictable pattern was observed among sites for the dates
sampled. In particular, no statistical differences in mean densities of algae
were identified among sites, although significant differences were observed
among some dates. Results from this study differed from those of Engman’s
(1984) study of Pool 19 algal communities, which identified clear differences
between the above-dam navigation-channel and vegetation-bed
communities. The current study differed also in lacking a cyanobacterial
peak in spring or summer (2.56% vs. Engman’s 11% of species composition).
It is possible that peaks in the abundances of some species may have
been missed if they occurred between sampling periods (March and May) in
the current study. This discrepancy could also have been due to changes
in current velocity through the vegetation bed resulting in a mixing of vegetation-
bed phytoplankton with those in the navigation channel, which may
have inhibited bloom-forming cyanobacteria.
400 Northeastern Naturalist Vol. 15, No. 3
Our results differed from the findings of Chandler (1937) and Baker and
Baker (1981), who observed a lower abundance of phytoplankton in regions
of heavy macrophyte vegetation. In the present study, Sites 1 and 7, both in
the center of the navigation channel, had the highest mean number of taxa
per site, which perhaps was due to greater discharge and turbulence causing
resuspension of benthic algae into the water column (Luttenton and Rada
1986, Luttenton et al. 1986, Wehr and Thorp 1997). Overall, Sites 3, 4, and
7 had the greatest diversity levels, which was perhaps caused by increased
complexity of the vegetation bed. A close grouping of sites for September in
the NMS analysis was associated with low algal diversity and a high percentage
of green algae (92%).
In our study, Site 1 differed from the other sites, especially in August (Fig. 4),
likely due to the large number of Chlamydomonas cells. This higher count could
be due to nutrient release by the fall senescence of upriver vegetation beds and
locally dense Lemna (duckweed) populations (S.E. Jenkins, unpubl. data).
Because the intake of the power plant is approximately 15 m east of the lock entrance
and the output is directly upstream of Site 4, it was predicted that the community
composition and abundance of Sites 1 and 4 would be similar, which in
general was observed. The non-significant decline in numbers of Chlamydomonas
cells indicates that they apparently were unaffected by passage through the
turbines and the approximately 12-m drop from the intake pipe to the turning
turbines, which may also damage cells. The level of Pool 19 is managed so that
sufficient water is taken in through the intake pipe, and thus a significant flow
of water is always moving through the power plant. This flow may be the only
way for water to move from above to below the dam at low river water levels and
may have had significant effects on abundances of algae immediately below
the dam. In addition, local planktivorous fauna including Hypophthalmichthys
molitrix (Valenciennes in Cuvier and Valenciennes) (Silver Carp), H. nobilis
(Richardson) (Bighead Carp), Polyodon spathula (Waldbaum) (Paddlefish)
(Coker 1923, Lazzaro et al 1992), bivalves (Gale and Lowe 1971, Raidow and
Hamilton 2001, Welker and Walz 1998), and other river invertebrates (Lamberti
and Moore 1984, Madenjian 1995) known to congregate along the power plant,
lock wall, and river bottom in this area (R.V. Anderson, unpubl. data) may also
have contributed to the observed reduction of green algal density.
The correlation between diversity and date supports the findings of the NMS
ordination and one-way Friedman tests. The clustering of some of the June and
July sites together in the NMS analysis is due to their sharing similar abundances
of certain species that did not occur on other dates. This pattern may be
the result of warmer temperatures and moderate availability of nutrients at this
time (Grubaugh et al. 1986). Similarities among Sites 4–8 may be explained by
the fact that water from above the dam passes through the power plant discharge
or outlet pipe, or the output pipe and the dam gates. Downstream wing dams
mix the water and forces the flow toward the Iowa side of the river to maintain
navigation channel depth, and may homogenize phytoplankton communities at
sites below the dam.
Consistent with other studies on the upper Mississippi River (Engman
1986), these analyses indicated significant temporal differences, with
2008 S.T. Meiers, S.E. Jenkins, and R.V. Anderson 401
diatoms being the most prevalent on all dates except September, and a spring
and fall increase in the overall abundance of algae. The higher densities
of algal cells in September and April were largely associated with greater
abundances of green algal taxa. The September increase in Chlamydomonas
sp., Echinosphaerella limnetica, and Scenedesmus quadricauda may be due
to the senescence and collapse of the vegetation bed at Site 3 andother beds
farther upriver, and the seasonal demise of local Lemna populations in side
channels and sloughs with a subsequent release of nutrients into the river. In
a study of macrophyte beds that encompassed the upriver locations and Site 3
of the current study, Grubaugh et al. (1986) observed no increase in sediment
organic matter in their macrophyte sites after Sagittaria (arrow-head) and
Nelumbo senesced and decayed, suggesting that nutrients had been released
into the water column downstream following senescence. Another potential
source of nutrients may be agricultural runoff from fertilizer application in
April–May and September–October. These events result in a pulse of nutrient
rich runoff that is readily available to microorganisms, phytoplankton, and
other river organisms (Grubaugh et al. 1986, Scholze 1994).
Despite the fact that there are many habitats that could allow the development
of significantly different phytoplankton communities, no clear or
predictable phytoplankton spatial patterns were observed in the present study.
The river above and below Lock and Dam 19 and its incorporated power
plant is a complicated system whose algal communities are apparently more
influenced by temporal factors than by physical differences in habitat. More
intensive sampling at the intake pipe, the power plant output, and slightly
downstream may reveal details as to the impact of the power plant turbines
and local planktivores on survival of local phytoplankton communities.
Acknowledgments
The authors wish to thank H. Courtois and Earthwatch SCAP (Student Challenge
Award Program) volunteers for their assistance collecting some of the samples used
in this study.
Literature Cited
Baker, A.L., and K.K. Baker. 1979. Effects of temperature and current discharge on
the concentration and photosynthetic activity of phytoplankton in the upper Mississippi
River. Freshwater Biology 9:191–198.
Baker, K.K., and A.L. Baker. 1981. Seasonal succession of the phytoplankton in the
upper Mississippi River. Hydrobiologia 83:295–301.
Chandler, D.C. 1937. Fate of typical lake plankton in streams. Ecological Monographs
7(4):445–479.
Clarke, K.R. 1993. Non-parametric multivariate analyses of changes in community
structure. Australian Journal of Ecology 18:117–143.
Clescerl, L.S., A.E. Greenberg, and A.D. Eaton. 1999. Standard Methods for the
Examination of Water and Wastewater, 20th Edition. American Public Health Association,
Washington, DC. 1325 pp.
Coker, R.E. 1923. Methuselah of the Mississippi. Scientific Monthly 16:89–103.
Engman, J.A. 1984. Phytoplankton distribution in pool 19, Mississippi River. M.Sc.
Thesis. Western Illinois University, Macomb, IL. 184 pp.
402 Northeastern Naturalist Vol. 15, No. 3
Fremling, C.R. 2005. Immortal River: The Upper Mississippi River in Ancient and
Modern Times. The University of Wisconsin Press, Madison, WI. 429 pp.
Gale, W.F., and R.L. Lowe. 1971. Phytoplankton ingestion by the fingernail clam,
Sphaerium transversum (Say) in pool 19, Mississippi River. Ecology 52:507–513.
Grubaugh, J.W., R.V. Anderson, D.M. Day, K.S. Lubinski, and R.E. Sparks. 1986.
Production and fate of organic material from Sagittaria latifolia and Nelumbo
lutea on pool 19, Mississippi River. Journal of Freshwater Ecology 3:477–484.
Huff, D.R. 1986. Phytoplankton communities in navigation pool no. 7 of the upper
Mississippi River. Hydrobiologia 136:47–56.
Jahn, L.A., and R.V. Anderson. 1986. The ecology of pools 19 and 20, upper Mississippi
River: A community profile. US Fish and Wildlife Service, [PROVIDE
LOCATION]. Biological Reports 85(7.6).
Kruskal, J.B. 1964. Nonmetric multidimensional scaling: A numerical approach.
Psychometrica 29:1–27.
Lamberti, G.A., and J.W. Moore. 1984. Aquatic insects as primary consumers. Pp.
164–195, In V.H. Resh and D.M. Rosenberg (Eds.). The Ecology of Aquatic Insects.
Praeger Publishers, New York, NY. 625 pp.
Lange, T.R., and R.G. Rada. 1993. Community dynamics of phytoplankton in a typical
navigation pool in the upper Mississippi River. Journal of the Iowa Academy
of Sciences 100:21–27.
Lazzaro, X., R.W. Drenner, R.A. Stein, and J.D. Smith. 1992. Planktivores and
plankton dynamics: Effects of fish biomass and planktivore type. Canadian Journal
of Fisheries and Aquatic Sciences 49:1466–1473.
Luttenton, M.R., and R.G. Rada. 1986. Effects of disturbance on epiphytic community
architecture. Journal of Phycology 22:320–326.
Luttenton, M.L., J.B. Vansteenburg, and R.G. Rada. 1986. Phycoperiphyton in selected
reaches of the upper Mississippi River: Community composition, architecture,
and productivity. Hydrobiologia 136:31–46.
Madenjian, C.P. 1995. Removal of algae by the Zebra Mussel (Dreissena polymorpha)
population in western Lake Erie: A bioenergetics approach. Canadian Journal
of Fisheries and Aquatic Sciences 52:381–390.
McCune, B., and J.B. Grace. 2002. Analysis of Ecological Communities. MjM Software
Design. Glendeden Beach, OR. 300 pp.
McCune, B., and M.J. Metford. 1999. PC-ORD for Windows, Version 4.25. MjM
Software Design. Gleneden Beach, OR.
Raidow, D.F., and S.K. Hamilton. 2001. Bivalve diets in a Midwestern US stream: A
stable isotope enrichment study. Limnology and Oceanography 46:414–522.
Reinhard, E.G. 1931. The plankton ecology of the upper Mississippi, Minneapolis to
Winona. Ecological Monographs 1:395–464.
Scholze, R.J. 1994. A summary of best management practices for nonpoint source
pollution. US Army Corps of Engineers, USACERL Technical Report EP-93/06.
National Technical Information Service, Springfield, VA.
US Geological Survey (USGS). 1999. Ecological status and trends of the upper
Mississippi River System 1998: A report of the Long Term Resource Monitoring
Program. LTRMP 99-T001. 236 pp.
Wehr, J.D., and J.H. Thorp. 1997. Effects of navigation dams, tributaries, and littoral
zones on phytoplankton communities in the Ohio River. Canadian Journal of
Fisheries and Aquatic Sciences 54:378–395.
Welker, M., and N. Walz. 1998. Can mussels control the plankton in rivers? A planktological
approach applying a Langrangian sampling strategy. Limnology and
Oceanography 43:753–762.

