2007 NORTHEASTERN NATURALIST 14(4):519–530
Clinal Variation in Ohio River Basin Populations of the
Redfi n Shiner (Lythrurus umbratilis)
David J. Eisenhour1,* and Lynn V. Eisenhour2
Abstract - Prior to this study, undocumented morphological variation in Lythrurus
umbratilis (Redfi n Shiner) has impaired identifi cation of many samples of eastern
populations of the species. Meristics, morphometrics, tuberculation, pigmentation,
and nuptial male coloration of over 700 specimens of L. umbratilis were examined in
order to assess patterns of geographic variation and species limits in the Ohio River
basin. Principle component and spatial autocorrelation analyses of these data demonstrate
that morphological variation in L. umbratilis is clinal along most of the length
of the Ohio River basin. Specimens from eastern populations have less black in the
dorsal fi n of breeding males, have lower mean scale counts, and are more slender
than western populations. The cline does not extend into central and northern Ohio,
as populations have relatively high meristic counts and more robust males. These
analyses suggest that recognition of an additional species in the Ohio River basin is
not warranted at this time. The cline may refl ect the infl uence of drainage evolution
of the region, or even past gene fl ow with Lythrurus fasciolaris (Scarlet Shiner), a
closely related species with a distribution parapatric to that of L. umbratilis.
Introduction
Lythrurus umbratilis (Girard) (Redfin Shiner) is a small cyprinid that
occurs throughout most of the Mississippi River basin, the southern Great
Lakes drainages, and some drainages along the West Gulf Slope. It is typically
common to abundant in its preferred habitat of pools and raceways
of small, warm, moderate-gradient streams. In the Ohio River basin, L.
umbratilis has a nearly parapatric distribution with Lythrurus fasciolaris
(Gilbert) (Scarlet Shiner) (Burr and Warren 1986, Etnier and Starnes 1993,
Stauffer et al. 1995, Trautman 1981). These species usually are ecologically
separated, with L. fasciolaris typically occupying streams with clearer
water, higher gradients, and coarser substrates than L. umbratilis. At their
contact zone, limited to extensive hybridization may occur, and some evidence
suggests L. umbratilis may be replacing L. fasciolaris, perhaps as a
result of environmental degradation (Burr and Warren 1986, Hopkins 2005,
Trautman 1981). Lythrurus umbratilis, L. lirus (Jordan) (Mountain Shiner),
and the L. ardens complex, which includes L. ardens (Cope) (Rosefin Shiner),
L. fasciolaris, and L. matutinus (Cope) (Pinewoods Shiner) (Dimmick
et al. 1996), appear to be closely related, probably forming a monophyletic
group (Pramuk et al. 2006, Schmidt et al. 1998). Phylogenetic analysis of
1Department of Biological and Environmental Sciences, Morehead State University,
Morehead, KY 40351. 2Rowan County School System, Morehead, KY 40351. *Corresponding
author - d.eisenhour@morehead-st.edu.
520 Northeastern Naturalist Vol. 14, No. 4
mtDNA data suggests L. umbratilis is sister to a clade containing L. lirus
and L. fasciolaris (Pramuk et al. 2006).
Snelson and Pfl ieger (1975) examined systematics of populations west of
the Mississippi River and recognized two subspecies, the darkly pigmented
Lythrurus umbratilis umbratilis in western Missouri and L. u. cyanocephalus
in eastern Missouri. Although they did not examine specimens from the Ohio
River basin, L. u. cyanocephalus has been assumed to be the form present in
the Ohio River basin (Burr and Warren 1986, Etnier and Starnes 1993). No
thorough systematic study of Ohio River basin populations has been published,
although published descriptions reveal apparent geographic variation in morphology
(Etnier and Starnes 1993, Robison and Buchanan 1988, Stauffer et
al. 1995), and L. umbratilis is suspected to be polytypic (W.C. Starnes, North
Carolina State Museum of Natural Sciences, Raleigh, NC, pers. comm.). Our
preliminary surveys suggested that considerable variation in morphology exists
in the Ohio River basin and a thorough systematic study was warranted.
Some eastern populations of L. umbratilis are so aberrant that they could be
misidentifi ed as L. fasciolaris using characters provided in various guides
(Etnier and Starnes 1993, Page and Burr 1991, Stauffer et al. 1995).
The objective of this study is to assess geographic patterns of morphological
variation in Ohio River basin populations of L. umbratilis and to determine
species limits in that region. We also discuss causes of clinal variation of L. umbratilis
and other fi shes with a similar clinal pattern in the Ohio River basin.
Methods
Institutional abbreviations are from Poss and Collette (1995), except
MOSU is used as the acronym for the Morehead State University Ichthyology
Collection. Morphological data were collected following the methods of Hubbs
and Lagler (1964), unless defi ned otherwise, and were analyzed using programs
available in SAS 9.1 as modifi ed by David L. Swofford. Eleven counts
(lateral-line scales, predorsal scale rows, scales above the lateral line, scales
below the lateral line, caudal peduncle scales, circumferential scales, anal fi n
rays, pelvic fi n rays, and pectoral fi n rays) were taken from 544 specimens of
L. umbratilis collected from 36 localities (Appendix 1) in the Ohio River basin
and adjacent watersheds. Sampling from geographic areas with suspected hybridization
with L. fasciolaris, such as the Salt River drainage (Hopkins 2005),
was avoided (Fig. 1). Vertebrae were counted from 110 specimens cleared
and stained using a protocol from Taylor and Van Dyke (1985). Twenty-nine
measurements (Eisenhour and Eisenhour 2004) were taken from 123 male
specimens and 94 female specimens selected from the pool of specimens used
in the meristic analysis. All measurements were made with digital calipers to
the nearest 0.1 mm; those under 5 mm were made with the aid of a dissecting
microscope. Truss-geometric protocol (Bookstein et al. 1985, Humphries et al.
1981, Strauss and Bookstein 1982) was used, in part, to archive body form. In
2007 D.J. Eisenhour and L.V. Eisenhour 521
addition, tuberculation, pigmentation, and life coloration were examined from
numerous specimens from the study area.
Multivariate analysis of meristic characters was accomplished using principal
component analysis (PCA). Principal components were factored from
a correlation matrix of 11 non-transformed meristic variables. Multivariate
analyses of morphometric variables were accomplished using sheared PCA
(Bookstein et al. 1985, Humphries et al. 1981) to eliminate overall size
effects. Principal components were factored from the covariance matrix of
29 log-transformed morphometric characters following recommendations
of Bookstein et al. (1985).
Spatial autocorrelation analysis tests whether values of a variable are
spatially independent (Legendre and Fortin 1989, Sokal and Oden 1978)
and has been useful in detecting clines in fishes such as Fundulus zebrinus
Jordan and Gilbert (Plains Killifish; Poss and Miller 1983), Aphredoderus
sayanus (Gilliams) (Pirate Perch; Boltz and Stauffer 1993), and Macrhybopsis
aestivalis (Girard) (Speckled Chub; Eisenhour 2004). Spatial
autocorrelation analysis was performed on 544 specimens of L. umbratilis
from 33 localities using the R Package, version 3.02 (Legendre and Vaudor
1991). For each locality, latitude and longitude were determined to the
nearest second and population means were used as variables. All meristic
variables and their PC 1 scores were subjected to spatial autocorrelation
analysis. The adjacency matrix used in spatial autocorrelation analysis
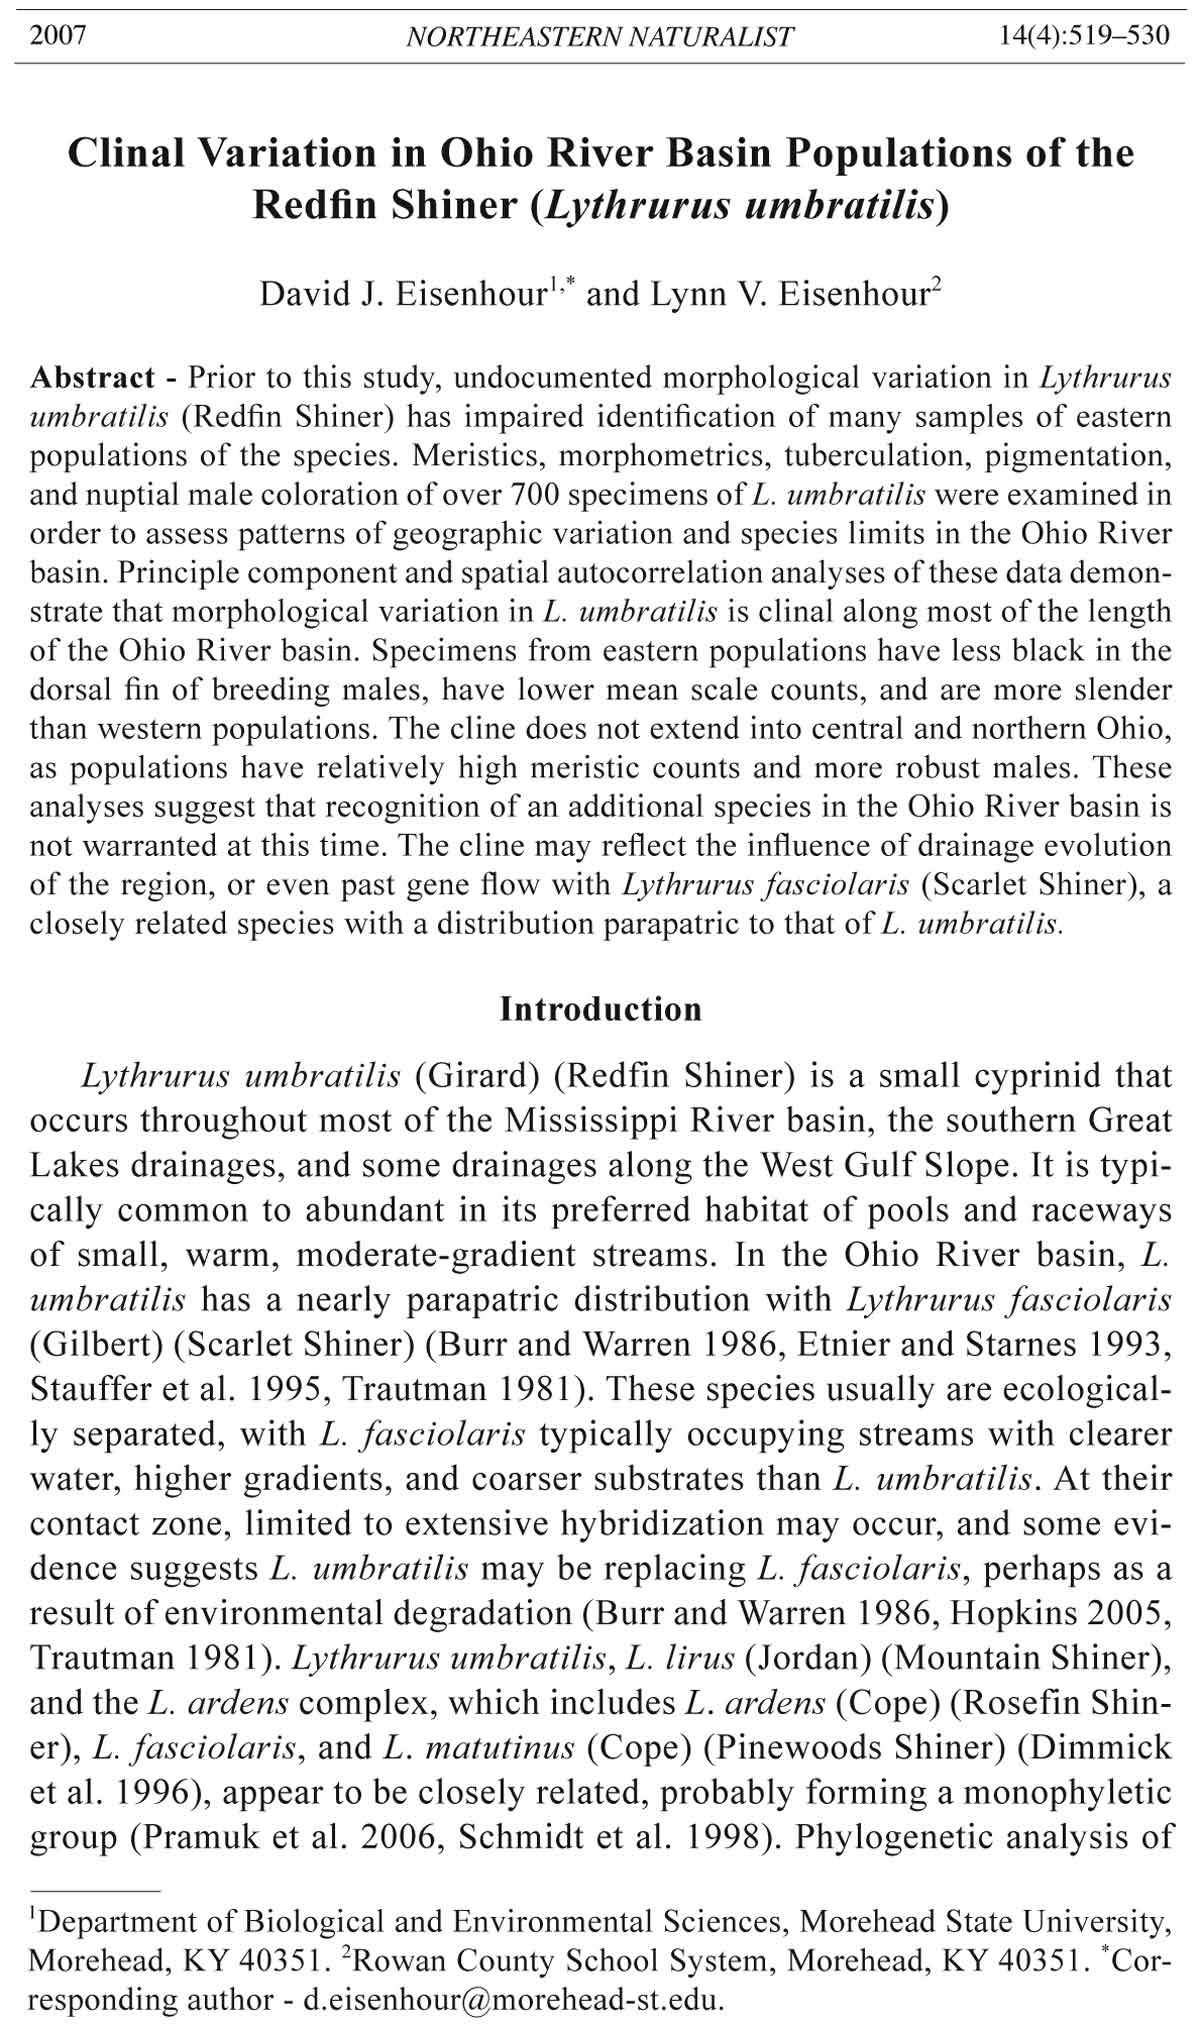
Figure 1. Localities from which specimens of L. umbratilis were examined. Photos
show differences in body shape of nuptial males: Left, 63 mm SL, MOSU 2165, Ferguson
Creek, Livingston County, KY, 21 June 2004; Right, 62 mm SL, MOSU 2160,
Slate Creek, Montgomery County, KY, 10 June 2004.
522 Northeastern Naturalist Vol. 14, No. 4
characterizes a fully connected graph in which each node (locality) is
connected to all others. Edge lengths (distance between localities) were
weighted by their geographic distance based on arc lengths. Comparisons
were made at 80-km intervals. This grouping provided at least 23 pairs in
all but the two largest distance classes, which had 9 pairs each.
We originally attempted to estimate melanophore coverage by analyzing
digital photographs of dorsal fins with Adobe Photoshop 6.0,
similar to the method used by Cox et al. (2005). However, results from
this failed to reflect readily apparent variation, perhaps because melanophores
exhibited a range of intensity, from pale brown to black. Instead,
percent melanophore coverage of dorsal fins of 69 nuptial males from
29 localities was visually estimated by each of the authors and averaged.
Correlation between each estimate was high (p < 0.001, r2 = 0.829). Regression
analysis was used to examine the relationship of melanophore
coverage to standard length (SL). Population means, from raw percent
melanophore coverage and from regression residuals, were subjected to
spatial autocorrelation analysis to test for the presence of clinal variation.
Methods follow those outlined above, except that comparisons were made
at 166-km intervals, providing at least 14 pairs in all but the two largest
distance classes, which had only 2 or 4 pairs.
Results
Western populations of L. umbratilis had higher mean scale counts than
eastern populations. Frequencies of two counts with the most pronounced
geographic variation, lateral-line scales, and circumferential scales, are presented
in Tables 1 and 2; other scale counts exhibited a similar pattern. Counts
of vertebrae, cephalic pores, and fi n rays exhibited local variation (e.g., several
populations have modally 10 anal-fi n rays), but no broad or concordant geographic
patterns were noted. Principle component analysis of the meristic data
separated mean population scores along an irregular east-west cline (Fig. 2),
Figure 2. Mean
meristic scores
on PC axes 1 and
2 for ten drainage
units of 544
L. umbratilis.
Percentages indicate
variation explained
by each
axis.
2007 D.J. Eisenhour and L.V. Eisenhour 523
Table 1. Frequency distribution of lateral-line scales for selected drainage units of L. umbratilis.
Drainage unit 37 38 39 40 41 42 43 44 45 46 47 48 49 50 51 52 53 54 55 56 57 n Mean
Lake Erie 1 6 5 3 5 14 3 2 2 2 1 1 45 42.5
Muskingum 2 - 5 1 2 5 4 4 2 25 44.6
West Virginia 2 2 4 8 12 12 7 4 2 4 2 1 2 62 42.1
Little Sandy 2 6 3 4 4 4 4 2 3 32 42.8
Licking 1 6 6 6 7 8 11 8 4 5 5 2 1 2 1 2 75 44.1
Green 1 - 2 5 3 9 8 8 9 8 1 54 44.2
Tradewater 1 - 2 1 4 4 5 6 9 3 6 3 2 - 1 - 1 1 49 45.7
Cumberland-Tennessee 1 2 7 4 5 2 6 10 2 5 3 2 - 3 52 45.1
Mississippi Valley 1 3 3 5 5 6 9 3 14 7 8 8 3 - 1 - 1 77 45.2
Southeast Missouri 1 - 1 3 3 6 4 5 9 10 11 8 3 2 2 1 1 - - 1 73 46.8
Table 2. Frequency distribution of circumferential scales for selected drainage units of L. umbratilis.
Drainage unit 31 32 33 34 35 36 37 38 39 40 41 42 43 44 45 46 47 48 49 n Mean
Lake Erie 10 12 8 12 2 1 45 34.7
Muskingum 1 2 4 6 5 1 1 25 36.9
West Virginia 2 9 8 25 9 5 4 62 34.9
Little Sandy 2 6 5 6 7 2 2 - 1 32 36.1
Licking 2 14 11 15 11 9 3 3 2 2 2 - 1 75 35.7
Green 3 8 15 13 8 4 1 1 54 35.7
Tradewater 1 - 3 5 7 9 12 4 2 2 3 1 49 36.5
Cumberland-Tennessee 2 10 11 11 9 4 4 1 52 37.9
Mississippi Valley 2 9 10 16 11 12 10 2 - 1 2 - - - 1 - 1 77 37.1
Southeast Missouri 1 - 6 16 9 13 11 8 3 2 3 2 3 1 73 38.0
524 Northeastern Naturalist Vol. 14, No. 4
although extensive overlap among populations was present in a plot of individual
scores. Most separation occurred along the PC 1 axis; examination of PC1
loadings indicated that western populations had higher scale counts (Table 3).
Although there was considerable local variation in body shape of nuptial
males, multivariate analysis of the entire morphometric data set did not
clearly reveal clinal variation or other geographic patterns (Fig. 3, top).
In general, males from the western Ohio River basin were more robust
than those from the eastern Ohio River basin (Fig. 1). Exceptions included
relatively robust males from Lake Erie drainages and proximate Ohio River
basin populations (Muskingum) and relatively gracile males from Black
River populations in southeast Missouri. Removal of these populations
from the sheared PCA, all at peripheral ends of the study area, resulted in a
graph that shows clinal variation of male body shape from that part of the
Ohio River basin (Fig. 3, bottom). Multivariate analysis of female body
shape revealed no obvious geographic trends in variation.
Despite substantial variation in dorsal-fin pigmentation of nuptial
males within populations, there was a general trend showing males from
western areas having darker fins than those from eastern areas (Fig. 4).
Mean melanophore coverage for western populations was 47% (n = 35),
43% (n = 6) for the Green River, and 18% (n = 28) for eastern populations.
Correlation between SL and dorsal-fin pigment was significant (p = 0.018),
although the relationship was weak (r2 = 0.284). Substitution of regression
residuals for raw melanophore-coverage percentages yielded a nearly identical
pattern of geographic variation. Qualitative assessment of additional
pigmentation patterns, chromatic coloration, and tuberculation of nuptial
males did not reveal meaningful geographic patterns of variation. We
judged males from the western Ohio River basin to have less red in median
fins, but this appears primarily due to dark melanophores masking red pigment
in specimens from that area.
Table 3. Principle component loadings for 11 meristic variables for 544 selected specimens of
L. umbratilis.
Variable PC1 PC2
Anal rays -0.05 0.35
Pelvic rays -0.01 0.42
Pectoral rays 0.20 0.14
Predorsal scales 0.41 -0.16
Lateral-line scales 0.40 0.04
Scales above the lateral line 0.40 0.00
Scales below the lateral line 0.31 -0.10
Caudal peduncle scales 0.33 0.02
Circumferential scales 0.49 -0.09
Infraorbital pores 0.09 0.67
Preoperculomandibular pores 0.12 0.44
Eigenvalue 2.78 1.21
Proportion of variance 25.3% 11.0%
2007 D.J. Eisenhour and L.V. Eisenhour 525
Clinal variation in morphological characters was further corroborated
by examination of correlograms (Fig. 5). All presented correlograms were
“globally tested” (Legendre and Fortin 1989) by adjusting the α level with
a Bonferroni correction and found to be signifi cant. Two variables (lateralline
scales and scales around the caudal peduncle) showed a “depression” or
bowl cline pattern (Sokal and Oden 1978) in which close populations show
signifi cant positive correlation, moderately distant locations show signifi cant
negative correlation, and very distant populations are mostly uncorrelated.
Figure 3. Mean
m o r p h o m e t r i c
scores on sheared
PC axes 2 and 3 for
male L. umbratilis.
Top, ten drainage
units of 123 males.
Bottom, eight
drainage units of
84 males. The bottom
graph is from
a sheared PCA excluding
samples
from the Muskingum
and Lake
Erie drainages in
Ohio and the Little
Black River drainage
in Missouri.
Figure 4. Photos of dorsal fins of nuptial males of L. umbratilis, showing variation
in pigmentation: (A) 53.8 mm SL, MOSU 1968, Dry Creek, Bollinger County, MO,
20 June 2003; (B) 50.6 mm SL, MOSU 1878, Massac Creek, McCracken County,
KY, 22 June 2002; (C) 50.2 mm SL, MOSU 1999, Flynn Fk., Caldwell County, KY,
22 June 2003; (D) 52.8 mm SL, MOSU 2184, Carter County, KY, 6 July 2004.
526 Northeastern Naturalist Vol. 14, No. 4
That is, populations at either end of the study area (Lake Erie, Muskingum,
and central Ozark populations) had higher counts than those in the middle
of the study area (Tables 1 and 2). The remainder of the variables examined
exhibited a fairly “smooth” clinal pattern in which close populations were
positively correlated and distant populations were negatively correlated
(Sokal and Oden 1978).
Discussion
Analysis of geographic patterns of morphological variation does not support
recognition of multiple species of L. umbratilis in the Ohio River basin.
Discrete geographic breaks in patterns of variation of morphological characters,
suggestive of breaks in gene fl ow and thus evolutionary independence,
are not apparent. The most marked shift in character variation, although minor,
is above the Green River drainage. However, some of the “steepness” of
the cline here may be due to a large geographic area just northeast of the Green
River, the Salt River drainage, that was not sampled (Fig. 1). Although L. umbratilis
is present in the lower part of the Salt River drainage and nearby small
direct tributaries to the Ohio River, morphological and genetic evidence from
this area indicates L. umbratilis is hybridizing with and possibly replacing L.
fasciolaris (Hopkins 2005). Thus, samples from these areas are inappropriate
to use because of probable introgression with L. fasciolaris.
Figure 5. Correlograms of 7 variables of L. umbratilis. Signifi cant autocorrelation is
indicated by closed symbols. Sample size is 544 for all variables except for dorsal
fi n pigment, which is 69.
2007 D.J. Eisenhour and L.V. Eisenhour 527
We recognize that in some cases, morphological intermediacy and clinal
variation are not due to genetic introgression, but to retained ancestral
polymorphism (Mayden 2002, Mayden and Wood 1995). In such a situation,
recognition of additional species-level diversity may be warranted. Because
no phylogenetic analysis providing a historical perspective is available, this
explanation cannot be completely discounted. However, invoking a retained
ancestral polymorphism explanation to recognize species on the ends of
clines requires an assumption that populations along the “cline” are isolated
from each other. This seems unlikely for L. umbratilis, as there are no natural
barriers to gene fl ow among most populations along the Ohio River basin.
Extensive hybridization between L. umbratilis and L. fasciolaris across a
broad area of the Ohio River basin supports the idea that these species have
the capacity for substantial migration and gene fl ow (Hopkins 2005).
The geographic pattern of variation in Ohio River basin L. umbratilis
could be due to (1) local selective pressures, (2) drainage evolution, (3) gene
fl ow with L. fasciolaris, or a combination of these factors. The pattern of clinal
variation in L. umbratilis is perhaps most similar to patterns of geographic
variation of Etheostoma kennicotti (Putnam) (Stripetail Darter; Page and
Smith 1976) and Percina maculata (Girard) (Blackside Darter; Steinberg
and Page 1999). Populations of these species in the upper part of the Ohio
River basin (Licking River upstream to Big Sandy River) were reported to
be morphologically different (although not diagnosable) from populations in
western Kentucky and Tennessee. Also, like L. umbratilis, these two species
have lower mean scale counts in specimens from the upper part of the Ohio
River basin, perhaps suggesting that larger scale size is adaptive in the upper
Ohio River basin, or is linked to locally adaptive genes. Perhaps morphological
convergence of upper Ohio L. umbratilis to L. fasciolaris may be due
to similar selective pressures, as well. In addition, clinal similarity across
taxa may refl ect the history of drainage evolution in the Ohio River basin
(Burr and Page 1986). Prior to the glacial advances of the Pleistocene, West
Virginia, southern Ohio, and eastern Kentucky were drained by the Teays
River, which fl owed westward across central Indiana and Illinois to join
the Mississippi River. Major modern rivers that likely fed the Teays include
the Kentucky, Licking, Big Sandy, and Kanawha rivers. The Pliocene Ohio
River was separate from the Teays River and was much smaller than at present,
supplied primarily by the Tennessee, Cumberland, Green, and lower
Wabash rivers. Thus, morphological differences of L. umbratilis along the
length of the Ohio River basin may be due to partial isolation of populations
in the Teays and Old Ohio watersheds, followed by gene fl ow subsequent to
capture of the Teays watershed by the Ohio River in the Pleistocene.
An additional explanation for the pattern of morphological variation
present in upper Ohio River basin L. umbratilis is that introgression with L.
fasciolaris has occurred. These species have a parapatric or narrowly sympatric
distribution (Burr and Warren 1986, Trautman 1981) in the upper Ohio
528 Northeastern Naturalist Vol. 14, No. 4
River basin from the Green River drainage upstream, providing opportunities
for genetic exchange. Historical geographic interactions of these species, perhaps
involving competitive exclusion, apparently has resulted in their unusual
“alternating” distributions in drainages of eastern Kentucky (L. fasciolaris in
the Kentucky River, L. umbratilis in the Licking River, L. fasciolaris in Tygart’s
Creek, and L. umbratilis in the Little and Big Sandy rivers). Lythrurus
umbratilis specimens in the upper Ohio River basin show morphological characteristics,
including reduced black pigment on the dorsal fi ns, a more slender
body, and lower scale counts, which are similar to those of L. fasciolaris. Evidence
of current or historical gene fl ow was documented by Hopkins (2005),
who found L. fasciolaris nuclear markers present in putatively “pure” populations
of L. umbratilis in southeast Ohio and northeast Kentucky.
Despite the similarities of upper Ohio River basin L. umbratilis and
L. fasciolaris, they can be diagnosed using morphological characters. All
L. fasciolaris lack black pigment in the dorsal fi n (other than the anterior
blotch), but breeding male L. umbratilis have at least some dark melanophores
scattered throughout, though they may not be visible without
magnifi cation. Suborbital tubercles consistently are present in breeding male
L. umbratilis, but absent in L. fasciolaris (Hopkins 2005). Although these
species differ in some scale and fi n-ray counts and in body shape (Hopkins
2005), pronounced overlap limits their utility as “diagnostic” characters.
Acknowledgments
We thank R.L. Hopkins, R.R. Hopkins, and J.D. Eisenhour for assistance in fi eld
collections and R.L. Hopkins for providing a helpful review of the manuscript. Access to
museum specimens was provided by B.M. Burr, T. Cavender, M. Kibbey, and J. Stewart.
Partial funding was provided by research grants from the Offi ce of Research, Grants,
and Contracts and the Institute for Regional Analysis and Public Policy, Morehead
State University. Specimens were removed from wild populations in accordance with
permits from Kentucky Department of Fish and Wildlife Resources, Tennessee Wildlife
Resources Agency, Missouri Department of Conservation, Ohio Division of Wildlife,
West Virginia Division of Natural Resources, and Morehead State University IACUC.
Literature Cited
Boltz, J.M., and J.R. Stauffer, Jr., 1993. Systematics of Aphredoderus sayanus
(Teleostei: Aphredoderidae). Copeia 1993:81–98.
Bookstein, F.L., B. Chernoff, R.L. Elder, J.M. Humphries, Jr., G.R. Smith, and R.E.
Strauss. 1985. Morphometrics in evolutionary biology. Academy of Natural
Sciences, Philadelphia Special Publication 15:1–277.
Burr, B.M., and L.M. Page. 1986. Zoogeography of fishes of the lower Ohio-upper
Mississippi basin. Pp. 287–324, In C.H. Hocutt and E.O. Wiley (Eds.). The
Zoogeography of North American Freshwater Fishes. John Wiley and Sons.
New York, NY. 866 pp.
Burr, B.M., and M.L. Warren, Jr. 1986. A Distributional Atlas of Kentucky Fishes.
Kentucky Nature Preserves Commission, Frankfort, KY. Science and Technical
Series 4. 398 pp.
2007 D.J. Eisenhour and L.V. Eisenhour 529
Cox, R.M., S.L. Skelly, A. Leo, and H.B. John-Alder. 2005. Testosterone regulates
sexually dimorphic coloration in the Eastern Fence Lizard, Sceloporus undulatus.
Copeia 2005:597–608.
Dimmick, W.W., K.L. Fiorino, and B.M. Burr. 1996. Reevaluation of the Lythrurus
ardens (Cypriniformes: Cyprinidae) complex with recognition of three evolutionary
species. Copeia 1996:813–823.
Eisenhour, D.J. 2004. Systematics, variation, and speciation of the Macrhybopsis
aestivalis complex west of the Mississippi River. Bulletin of the Alabama Museum
of Natural History 23:9–47.
Eisenhour, D.J., and L.V. Eisenhour. 2004. Morphological variation and systematics
of the Notropis rubellus complex (Teleostei: Cyprinidae) in Kentucky and Tennessee.
Southeastern Naturalist 3:431–450.
Etnier, D.A., and W.C. Starnes. 1993. The Fishes of Tennessee. University of Tennessee
Press, Knoxville, TN. 681 pp.
Hopkins, R.L. 2005. Hybridization of Lythrurus fasciolaris (Cope) and Lythrurus
umbratilis (Girard) (Cypriniformes: Cyprinidae) in the Ohio River Basin. Unpublished
M.Sc. Thesis. Morehead State University, Morehead, KY. 95 pp.
Hubbs, C.L., and K.F. Lagler. 1964. Fishes of the Great Lakes Region. University of
Michigan Press, Ann Arbor, MI. 213 pp.
Humphries, J.M., F.L. Bookstein, B. Chernoff, G.R. Smith, R.L. Elder, and S.L.
Poss. 1981. Multivariate discrimination by shape in relation to size. Systematic
Zoology 30:291–308.
Legendre, P., and M.-J. Fortin. 1989. Spatial pattern and ecological analysis. Vegetation
80:107–138.
Legendre, P., and A. Vaudor. 1991. The R Package: Multidimensional Analysis,
Spatial Analysis. Département de Sciences Biologiques, Université de Montréal,
Montréal, QC, Canada. 142 pp.
Mayden, R.L. 2002. On biological species, species concepts, and individuals in the
natural world. Fish and Fisheries 3:171–196.
Mayden, R.L., and R.M. Wood. 1995. Systematics, species concepts, and the evolutionary
signifi cant unit in biodiversity and conservation biology. Pp. 58–113, In
J.L. Nelson (Ed.). Evolution and the Aquatic Ecosystem: Defi ning Unique Units in
Population Conservation. American Fisheries Society, Bethesda, MD. 435 pp.
Page, L.M., and B.M. Burr. 1991. A Field Guide to Freshwater Fishes of North
America North of Mexico. Houghton Miffl in Co., Boston, MA. 422 pp.
Page, L.M., and P.W. Smith. 1976. Variation and systematics of the Stripetail Darter,
Etheostoma kennicotti. Copeia 1976:532–541.
Poss, S.G., and B.B. Collette. 1995. Second survey of fi sh collections in the United
States and Canada. Copeia 1995:48–70.
Poss, S.G., and R.R. Miller. 1983. Taxonomic status of the plains killifi sh, Fundulus
zebrinus. Copeia 1983:55–66.
Pramuk, J.B., M.J. Grose, A.L. Clarke, E. Greenbaum, E. Bonaccorso, J.M. Guayasamin,
A.H. Smith-Pardo, B.W. Benz, B.R. Harris, E. Siegfreid, Y.R. Reid, N.
Holcroft-Benson, and E.O. Wiley. 2006. Phylogeny of fi nescale shiners of the
genus Lythrurus (Cypriniformes: Cyprinidae) inferred from four mitochondrial
genes. Molecular Phylogenetics and Evolution 42:287–297.
Robison, H.W., and T.M. Buchanan. 1988. Fishes of Arkansas. University of Arkansas
Press, Fayetteville, AR. 535 pp.
530 Northeastern Naturalist Vol. 14, No. 4
Schmidt, T.R., J.P. Bielawski, and J.R. Gold. 1998. Molecular phylogenetics and evolution
of the cytochrome-b gene in the cyprinid genus Lythrurus (Actinopterygii:
Cypriniformes). Copeia 1998:4–22.
Snelson, F.F., Jr., and W.L. Pfl ieger. 1975. Redescription of the Redfi n Shiner, Notropis
umbratilis, and its subspecies in the central Mississippi River basin. Copeia
1975:231–249.
Sokal, R.R., and N.L. Oden. 1978. Spatial autocorrelation in biology 1. Methodology.
Biological Journal of the Linnaean Society 10:199–228.
Stauffer, J.R., Jr., J.M. Boltz, L.R. White. 1995. The fi shes of West Virginia. Proceedings
of the Academy of Natural Sciences, Philadelphia 146:1–389.
Strauss, R.E., and F.L. Bookstein. 1982. The truss: Body-form reconstruction in
morphometrics. Systematic Zoology 31:113–135.
Steinberg, R., and L.M. Page. 1999. Geographic variation in the blackside darter,
Percina maculata (Teleostei, Percidae), in the Ohio River drainage of Kentucky.
Journal of the Kentucky Academy of Science 60:94–107.
Taylor, W.R., and G.C. Van Dyke. 1985. Revised procedures for staining and clearing
small fi shes and other vertebrates for bone and cartilage study. Cybium
9:107–119.
Trautman, M.B. 1981. The Fishes of Ohio, 2nd Edition. Ohio State University Press,
Columbus, OH. 782 pp.
Appendix 1. Specimens of Lythrurus umbratilis examined in quantitative analyses.
Parenthetical numbers refer to number of specimens used in the meristic,
morphometric, and dorsal-fi n pigmentation analyses, respectively. Cleared and
stained specimens used for vertebral counts are identifi ed by “CS.”
Lake Erie: OSUM 17227 (3,0,0), OSUM 17325 (3,2,0), OSUM 21558 (24,5,0),
OSUM 52126 (15,4,0).
Muskingum: OSUM 50941 (9,6,0), OSUM 73744 (4,3,0), OSUM 73869 (7,1,0),
OSUM 73340 (5,4,0).
West Virginia: MOSU 2197 (9,3,0), MOSU 2010 (7,2,0), MOSU 2009 (11,7,1),
MOSU 2188 (30,4,2), MOSU 2189 (35 CS), MOSU 2186 (4,1,0).
Little Sandy: MOSU 1930 (3,3,2), MOSU 2008 (15,8,2), MOSU 2184 (14,6,3).
Licking: MOSU 1832 (27,16,7), MOSU 1962 (18,4,3), MOSU 1963 (30 CS), MOSU
1835 (21,13,3), MOSU 2160 (6,4,1), MOSU 1462 (3,3,0).
Green: West MOSU 1839 (19,9,1), MOSU 1792 (8,3,2), MOSU 1967 (17,6,4),
MOSU 2167 (10,8,3), MOSU 2168 (13 CS).
Tradewater: MOSU 1999 (22,6,2), MOSU 2285 (20,5,1), MOSU 875 (7,1,0).
Cumberland-Tennessee: MOSU 1970 (20,6,7), MOSU 1975 (32 CS), MOSU 1343
(18,4,1), MOSU 2165 (14,5,2).
Mississippi Valley: SIUC 42837 (6,6,0), SIUC 34798 (25,10,0), MOSU 2208 (2,1,0),
MOSU 1978 (17,6,3), MOSU 1878 (13,12,4), MOSU 1987 (15,4,1).
Southeast Missouri: MOSU 1968 (20,12,4), MOSU 2280 (25,5,5), MOSU 2284
(28,6,4).