2007 NORTHEASTERN NATURALIST 14(2):183–206
Detection and Monitoring of Invasive Exotic Plants:
A Comparison of Four Sampling Methods
Cynthia D. Huebner*
Abstract - The ability to detect and monitor exotic invasive plants is likely to vary
depending on the sampling method employed. Methods with strong qualitative
thoroughness for species detection often lack the intensity necessary to monitor
vegetation change. Four sampling methods (systematic plot, stratified-random plot,
modified Whittaker, and timed meander) in hemlock and red oak forests in the
Delaware Water Gap National Recreation Area were compared for their ability to
detect and monitor understory exotic invasive plant species. The timed-meander
method best detected exotic invasive plants and documented richness. The stratified-
random method was similar to the timed-meander method in terms of detection
of exotic invasives and defining richness, but also provided estimates of species
abundances and diversity. An initial combination of the timed-meander and stratified-
random sampling designs followed by monitoring with the stratified-random
method is suggested as a standard approach.
Introduction
Successful early detection and subsequent monitoring of exotic invasive
plant species in a forested area depend on the chosen sampling design.
Methods that best measure richness of an area (e.g., timed meander) are
limited by a qualitative estimate of species importance and an inability to
define other vegetation patterns (Goff et al. 1982, Palmer 1995, Palmer et al.
1995). Likewise, those methods that enable a researcher to quantify the
relative importance of each species and other patterns (e.g., systematic plots/
grids) are limited by cost and time to adequately sample enough area for a
full flora record (Peet et al. 1998, Stohlgren et al. 1998, Yorks and Dabydeen
1998). A sampling design that detects rare species, such as early establishing
exotics, but is also capable of defining vegetation patterns and individual
species’ relative importance, would be optimal. Such a standard design
could serve as a method for both early detection and long-term monitoring of
invasions and impacts on associated native species (Etchberger and
Krausman 1997, Peet et al. 1998, Stohlgren et al. 1998, Stokes and Yeaton
1994, Yorks and Dabydeen 1998).
In this paper, detection is defined as the ability to document the presence of
a species, especially one that is rare in abundance compared to other species.
Monitoring is defined as documentation of species’ relative abundance over
time. The goal of this research is to compare the utility of four methods to
accurately describe all species present and their relative abundance, with
particular interest in each method’s ability to detect early-establishing exotic
*USDA Forest Service Northern Research Station, 180 Canfield Street, Morgantown,
WV 26505; chuebner@fs.fed.us.
184 Northeastern Naturalist Vol. 14, No. 2
invasive or rare species. While mapping and survey methods that focus on
particular species can efficiently describe the distribution of those species and
monitor them for adaptive management purposes (Dewey and Anderson
2004), such methods do not accurately describe the relative abundance of the
focal species nor are they designed to detect any non-focal species.
Sampling-method performance is dependent on the heterogeneity of the
sampled vegetation type and the scale of the study. The required sampling
intensity is determined in part by whether one defines a sample area’s boundary
by dominant vegetation homogeneity or by deliberate inclusion of the maximum
amount of variation (i.e., sampling across an environmental gradient).
Researchers seeking to classify vegetation types, or compare impacts of a
treatment to a priori defined vegetation types, often stratify the sample area
into homogeneous vegetation types (Barnes et al. 1982), which may also follow
one or more resource gradients (Sardinero 2000). Researchers or land managers
who wish to survey a defined area (such as a National Park or natural area)
often focus on potential variation found across several resource gradients
instead of nested homogeneous areas (Austin and Heyligers 1989). Focusing
on heterogeneity, especially in large areas, may result in a loss of information in
presumed homogeneous areas (Taylor et al. 1984). This study focuses on
relatively small homogeneous forested areas (less than 5 ha). However, seemingly
homogeneous forests, usually defined by the dominant tree species, are
often quite heterogeneous at micro-topographic scales.
The homogeneity of a vegetation type may be impacted by different
disturbances, and these effects may differ by forest stratum. For instance,
while the vegetation is defined by an existing dominant canopy species, such
as hemlock or oak, new canopy openings and changes in soil nutrients
caused by tree death and insect or pathogen defoliation may result in a more
heterogeneous understory (Beatty 2003, Orwig and Foster 1998, Yorks et al.
2001). The understory is where most of the early establishing exotic invasive
species are likely to be found. Certain disturbances, such as early stages of
insect defoliation, gap formation, and patchy burns, make defining homogeneous
areas difficult. A more intense sampling design may be necessary to
detect exotic plant species in early stages of establishment in forests, because
exotics tend to respond positively to disturbances (Hobbs and
Huenneke 1992, Lonsdale 1999).
The purpose of this study is to compare the effectiveness of four sampling
methods of varying intensity—systematic plot, stratified-random plot
with two scales, modified Whittaker, and timed meander—in detecting and
monitoring exotic invasive plant species in relation to associated species
within two forest types of the northeastern United States. Each of the four
methods is commonly used to sample eastern deciduous forest understory
vegetation (Elzinga et al. 2001, Goff et al. 1982).
Two questions are addressed: 1) Which of the four methods best detects
exotic invasive species and defines the true species composition or flora?
and 2) which method best describes plant species’ relative abundance and,
2007 C.D. Huebner 185
consequently, may monitor vegetation change (i.e., invasion) more accurately?
It is hypothesized that the stratified-random plot or modified
Whittaker methods will be best at detecting and monitoring early-establishing
exotics because both combine the positive quantitative aspect of the
systematic-plot method and the qualitative thoroughness of the timed-meander
method.
Materials and Methods
Study area
The Delaware Water Gap National Recreation Area (DWGNRA) is located
in Pennsylvania and New Jersey, 60 km on either side of of the
Delaware River (41°00'00" to 41°22'30"N and 74°52'30" to 75°02'30"E).
Within the DWGNRA, there are approximately 22,000 ha of forested land,
6% of which is evergreen (Pinus strobus L. [white pine] and Tsuga
canadensis (L.) Carrière [eastern hemlock]), 85% deciduous (Quercus rubra
L. [northern red oak], Acer saccharum Marshall [sugar maple], Q. montana
Willd [chestnut oak], A. rubrum L. [red maple], and Betula lenta L. [yellow
birch]), and 9% mixed deciduous and evergreen (Young et al. 2002).
Using a 1981 National Park Service database of the DWGNRA vegetation
cover (Myers and Irish 1981), three hemlock stands and three red oak
stands with at least 80% canopy cover and at least two ha in size, but no
larger than five ha, were randomly selected and ground truthed for size,
dominant vegetation, and degree of disturbance. The hemlock stands were
infested with hemlock woolly adelgid, and moderate (25–50%) levels of
defoliation were evident in a few trees within each stand (Royle and
Lanthrop 1997). The red oak stands may have had a history of Lymantria
dispar L. (gypsy moth) defoliation, but no defoliation was currently evident.
Both forest types were located in a landscape impacted by current and
historic human disturbances, such as fragmentation, roads, agriculture, harvesting,
and recreation. All selected stands were at least 200 m long and 100
m wide; this criterion eliminated several steep narrow hemlock slopes.
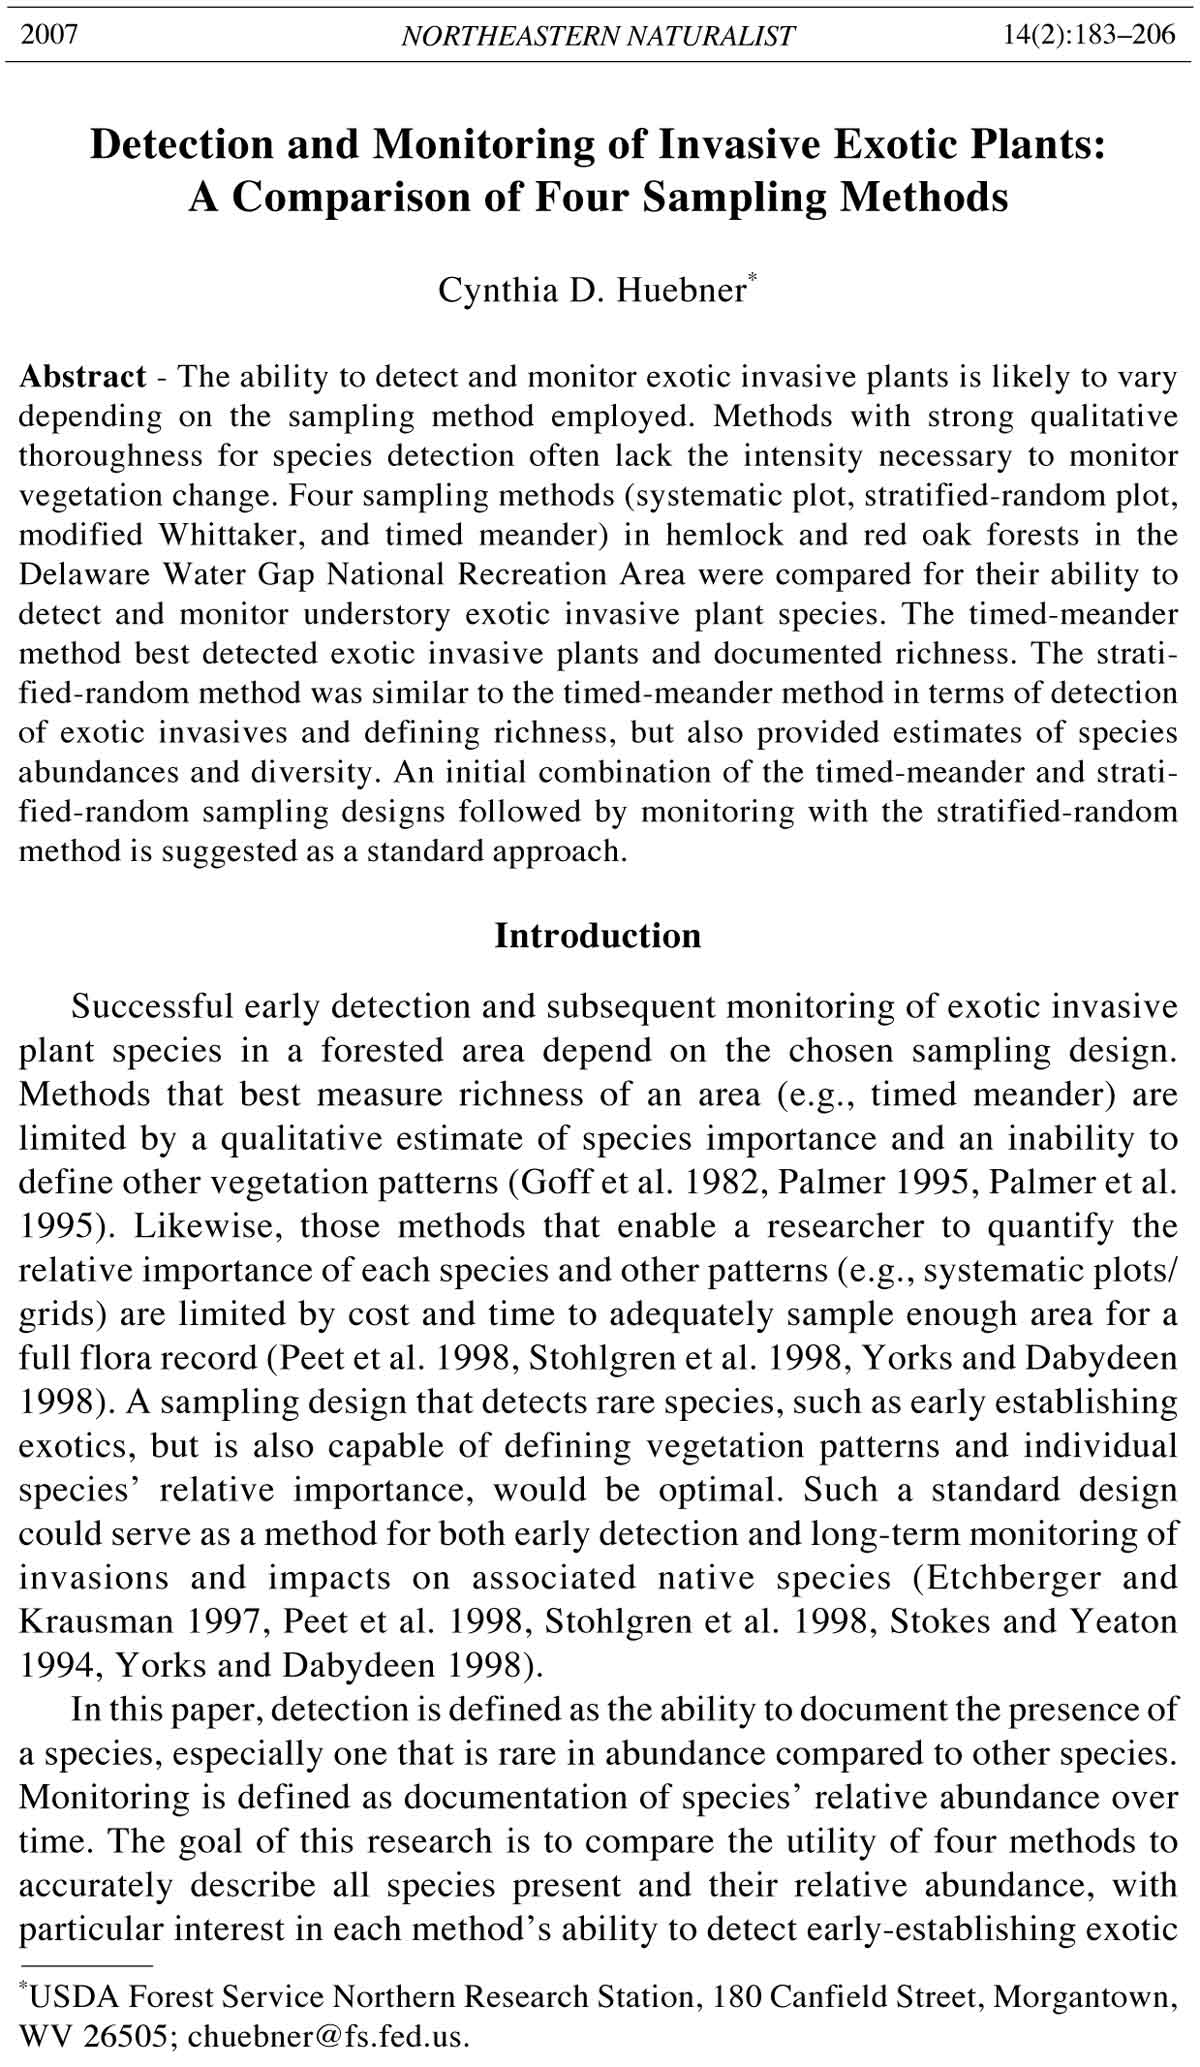
Sampling methods
The systematic-plot method, hereafter referred to as the systematic
method, contained 32 one-m2 plots arranged along a 200-m central transect.
Four plots placed at each cardinal direction were arrayed 1 m away from a
point 15 m on either side of the transect, at 50-m intervals along the transect
(Fig. 1a). Percent cover of herbs, shrubs, and vines rooted in the plots, and
percent cover and density of the tree seedlings under 1 m in height
and rooted in the plots were measured for all plots. Cover was estimated to
the 0.25% level using a plastic Mylar circle that was 0.5% of the 1-m2 area.
There was a < 0.25%-cover category arbitrarily given a value of 0.13%. This
method sampled 0.2% of each site.
The stratified-random plot method, hereafter referred to as the random
method, was composed of 60 plots, 40 of which were 1 m2 in size and 20 of
186 Northeastern Naturalist Vol. 14, No. 2
which were 10 m2 in size. These plots were stratified every 10 m along the
200-m central transect and at random distances (within the boundaries of
the plot and not overlapping the plots on the transect) perpendicular to the
transect (Fig. 1b). Percent cover in all 1-m2 plots was estimated as described
in the systematic method. In the 10-m2 plots, a 0.5% Mylar circle was used to
Figure 1. The four sampling
methods: a. systematic plot
method, b. stratified-random
plot method, c. modified
Whittaker method, and d.
timed-meander method.
2007 C.D. Huebner 187
estimate cover of each herb, shrub, vine, and tree seedling species rooted in
the plot, and I also calculated for each tree species the density of seedlings
under 1 m in height and rooted in the plot. All site averages for species
importance values were calculated per 1 m2 (i.e., the differences in plot areas
were taken into account before determining species importance). The random
plot method may suffer less from autocorrelation bias associated with
many transect and quadrat methods (Barnett and Stohlgren 2003, Stohlgren
et al. 1998) because two-thirds of the plots are randomly located on either
side of the central transect. This method sampled 0.7% of each site.
The modified Whittaker method included one large 1000-m2 rectangular
plot centrally located in the stand with one rectangular 100-m2 plot, two
circular 10-m2 plots, and 10 circular 1-m2 plots nested within the 1000-m2
plot (Shmida 1984; Stohlgren et al. 1995, 1997a; Yorks and Dabydeen
1998). This design differs from the literature because the 1-m2 and 10-m2
plots were circular (as in the plot and random methods) instead of square as
in the literature (Fig. 1c). Percent cover of each herb, shrub, vine, and tree
seedling species, as well as density of each tree seedling species rooted in
the plot, were estimated in the 1-m2 plots as in the previous two methods.
Herbs, shrubs, vines, and tree seedlings under 1 m present in the other plots
were recorded. If species were present in any of the nested plots, they were
not counted again in the 1000-m2 area. All site averages for species
importance values were calculated per 1 m2, so that differences in plot areas
were taken into account before determining species importance. This
method sampled 5% of each site.
The timed-meander method entailed thoroughly walking each site
(within the 2-ha area) for one hour noting the time every 10 minutes as new
species were tallied (Goff et al. 1982; Fig. 1d). If the number of new species
listed did not decrease to zero in the last 10 minutes of walking, additional
time would have been added, but this was not necessary. Because this is a
plotless method, any variables based on plots could not be analyzed. This
method sampled 100% of each site.
Importance values were calculated using relative cover for the herbs,
shrubs, and vines, and relative cover and relative density for the tree seedlings
for all measurable plots in each method. In the modified Whittaker
plots that had only presence or absence information, each present species
was arbitrarily given a value of 0.13 (similar to the more rare species that
have a cover value of < 0.25%) before combining importance value estimates
for each site. For the timed-meander method, importance values could
only be based on species presence or absence in each site; relative values
based on the number of other species present in each site were then calculated.
Species importance values were pooled for all three sites in each forest
type within each method (Appendix 1).
Variables
Fifteen site-vegetation variables were evaluated: (1) richness, (2) number
and (3) abundance of exotic invasives, (4) number and (5) abundance of
188 Northeastern Naturalist Vol. 14, No. 2
exotics that are not invasive (referred to as “exotics”), (6) number and (7)
abundance of native invasives, (8) number and (9) abundance of native weeds/
early successional species (referred to as “native weeds”), (10) number and
(11) abundance of native species that are mutually exclusive of the other
categories (referred to as “natives”), (12) species diversity, (13) species
evenness, (14) number of predicted species from the species-area curve
(referred to as “predicted species”), and (15) percent empty plots. Question 1,
which asks which method best detects exotic invasive species and defines a
true flora, was addressed by comparing richness and number of species within
each species category using all four methods. The method that documents the
highest number of species overall and within each category is considered
the best. Question 2, which asks which method best describes plant species’
relative abundance and vegetation patterns, was addressed by comparing the
abundance (percent cover) estimates of each of the above five species categories
as well as species diversity, species evenness, predicted species, and
percent empty plots using all methods but the timed-meander method. The
method that samples the most area and whose predicted species (based on
species area curves) is most similar to the highest number of actual species
documented is considered the best method. Differences in forest type were
also evaluated using the same 15 variables in order to help explain any
potential interactions with sampling method.
Shannon’s index (H') was used to estimate the diversity for each site, and
evenness was calculated by dividing H' by the natural log of each site’s
richness (McCune and Mefford 1999). The Simpson index gave similar
results and will not be presented. These diversity indices should be scrutinized
further because their results are dependent on both number of species
and the abundance of each species. For instance, sites with a high
species number but few individuals (or low overall cover) tend to show only
intermediate values of H' as a mathematical artifact of how H' is calculated
(Austin 1999). Because the methods are being compared within the same
area at one time period, species cover should not differ. However, when
comparing forest types, the potential differences in species cover may influence
any noted significant differences in H'; i.e., oak-dominated sites may
show higher H' values than the hemlock sites because most of the understory
species in the oak stands may tend to have higher overall cover values.
Species-area curves and estimates of predicted species richness using the
first-order jackknife estimator (Chiarucci et al. 2001) were calculated in
PCORD v. 4 (McCune and Mefford 1999). Predicted species richness for
modified Whittaker data was also calculated as a linear regression using S =
b + d log10A, where S = number of species, b = the y intercept, d = the slope
of the regression line, and A = the sample areas (1 m2, 10 m2, 500 m2, and
1000 m2; Stohlgren et al. 1995, 1997a, 1997c).
Exotic species were defined using several published state and regional
flora (Fernald 1970, Gleason and Cronquist 1991, Rhoads and Block
2000). Determination of invasive exotic species was conservative, being
2007 C.D. Huebner 189
based on shared species included on Mid-Atlantic state exotic invasive
plant species lists (Harmon 1999, Invasive Plant Council of New York
2003, McAvoy 2001, Native Plant Society of New Jersey 2003, Pennsylvania
Department of Conservation and Natural Resources 2000, Virginia
Department of Conservation and Recreation and Virginia Native Plant
Society 2001), a USDA Forest Service list (USDA Forest Service, Eastern
Region 1998), and published flora (Gleason and Cronquist 1991, Rhoads
and Block 2000). Native invaders were defined by documentation in the
literature on each species’ invasiveness (de la Cretaz and Kelty 1999, Hill
and Silander 2001, Luken 2003). The native weeds/early successional/gap
species category may be the most subjective because it is based on a
combination of information in flora and general ecological literature
(Fernald 1970, Gleason and Cronquist 1991, Rhoads and Block 2000,
Spurr and Barnes 1980). Nomenclature follows Gleason and Cronquist
(1991) and Rhoades and Block (2000). All sampling was conducted by the
author and a botanist trained (over the past five years) by the author to
ensure consistency and accuracy (Helm and Mead 2003, Kercher et al.
2003). All sites were sampled between July 17 and July 29, 2002, and each
took approximately 1.5–2 days to sample using all four methods, starting
with the random method, followed by the plot method, then the modified
Whittaker, and finally the timed meander.
Statistical analysis
All comparisons were made at the site level (plot information being
averaged in all but the timed-meander method). Herbs, vines, and shrubs
were analyzed as a group separately from the tree seedlings. Percent similarity
of species composition based on presence/absence data was determined
using the Sorensen coefficient of similarity for each method-pair comparison
for all sites and within each forest type (Kent and Coker 1992, van
Tongeren 1987). Differences in Sorensen similarity for paired methods were
tested using a one-way ANOVA, and multiple comparisons were made using
Tukey’s tests of significance; normality and homogeneous variance assumptions
were met (Proc GLM in SAS 9.1).
A mixed-model repeated measures analysis (site as the random effect,
method and forest type as the fixed effects) with an unstructured covariance
model was used to test for differences among methods and forest types, as
well as any interactions between methods and forest types, for each of the 15
vegetation variables (Proc Mixed in SAS 9.1). The abundance estimates of
exotic invasives, exotics, native invasives, and native weeds for the herbs,
vines, and shrubs were transformed (log10) to ensure normality; a nonparametric
smoothing function was incorporated in the mixed ANOVA models
for the counts of exotic invasives, exotics, native weeds, and native
invasives of the herbs, vines, and shrubs using a quadratic regression spline
model and a toeplitz covariance structure (Proc Mixed in SAS 9.1; Pedan
2003). The same nonparametric smoothing procedure was used on the seedling
count and abundance estimates for exotic invasives and native weeds as
190 Northeastern Naturalist Vol. 14, No. 2
well as percent empty plots. Multiple comparisons were based on the likelihood-
ratio statistic using the SLICE option in Proc Mixed (Proc Mixed in
SAS 9.1; Littell et al. 1998).
Results
The timed-meander method took a half hour, the systematic method 1–2
hours, the random method 2–4 hours, and the modified Whittaker 2–3 hours
for two botanists to complete. Sampling time included plot set up.
Which method best detects exotic invasive species and defines a true
composition or flora?
There were a total of 236 herb, shrub, and vine species (methods and forest
types combined), with 82, 152, 119, 184 species found using the systematic,
random, modified Whittaker, and timed-meander methods, respectively, and
176 and 160 species in the hemlock and oak stands, respectively. There were a
total of 38 tree seedling species (methods and forest types combined), with 27,
31, 29, and 31 species found using the systematic, random, modified
Whittaker, and timed-meander methods, respectively, and 31 and 34 species
in the hemlock and oak stands, respectively.
Description of exotic invasive species found. There were a total of 12
different invasive exotic herb, shrub, and vine species (methods and forest
types combined), with 6, 8, 8, and 8 different species detected using
the systematic, random, modified Whittaker, and timed-meander methods,
respectively. The methods differed within each forest type in terms
of the exotic invasive plants they defined as most important (1 indicating
highest ranking invasive exotic species by relative importance value;
Table 1). Despite a lack of pattern among the methods and forest types,
Alliaria petiolata (Bieb.) Cavara & Grande (garlic mustard), Berberis
Table 1. Exotic invasive herb, vine, and shrub species ranking by method and forest type. T =
Tsuga canadensis (hemlock) forests and Q = Quercus rubra (red oak) dominated forests. Ranks
are based on site-level importance values. Highest ranking species = 1; species with equal
rankings have equal relative importance values; - = not present.
Modified Timed
Systematic Random Whittaker meander
Species T Q T Q T Q T Q
Alliaria petiolata (Bieb.) Cavara & Grande - 1 3 1 3 - 1 1
Anthoxanthum odoratum L. - 1 - - 3 - 3 -
Berberis thunbergii D.C - 2 1 4 1 1 2 2
Berberis cf. vulgaris L. - - - 6 - - - -
Celastrus orbiculatus Thunb. - - - 3 - 3 - -
Elaeagnus umbellata Thunb. - - - - - - - 2
Euonymus alatus (Thunb.) Siebold - - - 5 - - - -
Lonicera morrowii A. Gray - - - 6 - 1 5 3
Microstegium vimineum (Trin.) A. Camus - 3 2 - 3 2 1 1
Poa compressa L. 1 2 - - - - - -
Rosa multiflora Thunb. - 3 4 2 - 3 - 2
Rumex acetosella L. - - - - 2 - 4 -
2007 C.D. Huebner 191
thunbergii DC. (Japanese barberry), and Microstegium vimineum (Trin.)
A. Camus (Japanese stiltgrass) appeared to occur more commonly among
the 12 exotic invasive species present. Rumex acetosella L. (sheep sorrel)
was found only in hemlock forests, and Celastrus orbiculatus Thunb.
(oriental bittersweet), Elaeagnus umbellata Thunb. (Autumn olive), and
Euonymus alatus (Thunb.) Siebold (winged euonymus) were found only
in oak forests. Ailanthus altissima (Miller) Swingle (tree of heaven) was
the single exotic invasive tree seedling present, occurring only in the
hemlock stands, but was detected by all methods. The systematic, random,
modified Whittaker, and timed-meander methods detected 2, 5, 6,
and 7 exotic invasive species, respectively, in hemlock forests, and 6, 7,
5, and 6 exotic invasive species, respectively, in oak forests, which suggests
that sampling method choice for detection of exotic invasives may
be more important in hemlock forests. Epipactis helleborine (L.) Crantz
(bastard hellebore), an orchid species categorized as a non-invasive exotic,
ranked relatively high, which may indicate it could become invasive.
It was detected by all methods in the hemlock sites in which it was more
common, but only the random and plot methods detected this species in
the oak sites.
Overview of species composition. When comparing all sites for herbs,
shrubs, and vines, none of the composition similarity values for each
Figure 2. Percent similarity of method pairs based on presence/absence vegetation
composition data for the hemlock forests. The Sorensen coefficient of similarity was
used to compare each method pair. S = systematic plot method, R = stratified-random
method, MW = modified Whittaker method, TM = timed-meander method. Method
pairs with different letters are significantly different at 0.05.
192 Northeastern Naturalist Vol. 14, No. 2
method pair were significantly different, though there was a trend for the
random, modified Whittaker, and timed-meander methods to be more
similar to each other than to the systematic method. The tree-seedling
composition showed greater overall similarity among all methods for
combined forest types (range = 65–80%) and within each forest type
(range = 45–80%), with higher percent similarity values than noted for
the herbs, shrubs, and vines (combined forest types range = 40–50%;
separate forest types range = 30–60%).
A comparison of composition similarity of method pairs within each
forest type for herbs, shrubs, and vines showed that there were significant
differences in similarity among the methods within the hemlock forests (F =
8.11, df = 5, P < 0.001; Fig. 2), but not the oak-dominated forests. The
random, modified Whittaker, and timed-meander methods were much more
similar to each other than they were to the systematic method in hemlock
forests, though the modified Whittaker method was not significantly different
from the systematic method. There were no significant differences in
similarity among methods for either forest type for tree seedlings, though in
both forest types the compositions resulting from the random, modified
Whittaker, and timed-meander methods tended to be more similar to each
than to the systematic method.
Table 2. Herb, shrub, and vine variable means for all sites by method. Means with different
superscript letters are significantly different ( 0.05). Standard errors are in parentheses. Not
applicable (NA) designates those parameters which cannot be compared due to missing plot
measures. Richness is observed counts of different species. Predicted species is the observed
richness adjusted for sample size. Abundance equals the average actual percent cover per 1-m2
plot for each site. Diversity is calculated using Shannon’s index H'. Evenness is H' divided by
the natural log of each site’s observed richness.
Modified Timed
Variable Systematic Random Whittaker meander
Richness 24.2B (4.70) 49.5A (8.74) 35.5B (9.40) 65.0C (6.83)
Exotic invasives
Number 1.5A (0.50) 2.3A (0.88) 2.2A (0.87) 4.3B (0.56)
Abundance 0.027 (0.013) 0.020 (0.015) 0.042 (0.036) NA
Exotics
Number 0.33 (0.21) 0.83 (0.40) 0.67 (0.21) 1.33 (0.42)
Abundance 0.0039 (0.0039) 0.0072 (0.0045) 0.00016 (0.00015) NA
Native invasives
Number 2.2A (0.65) 3.5AB (0.56) 2.2A (0.60) 4.0B (0.36)
Abundance 2.30 (1.73) 1.41 (0.89) 0.63 (0.63) NA
Native weeds
Number 1.0 (0.47) 1.8 (0.37) 1.5 (0.47) 2.0 (0.45)
Abundance 0.027 (0.016) 0.016 (0.012) 0.002 (0.001) NA
Natives
Number 17.5B (3.08) 36.8A (6.41) 27.2B (6.24) 48.8C (5.20)
Abundance 5.35 (2.48) 3.07 (1.26) 4.07 (2.08) NA
Predicted species 36.0B (6.4) 72.3A (11.7) 59.8AB (14.3) NA
Diversity 2.19B (0.203) 2.81A (0.264) 2.82A (0.316) NA
Evenness 0.72 (0.057) 0.74 (0.059) 0.82 (0.067) NA
Percent empty plots 31.3 (10.1) 27.2 (9.40) 33.3 (10.3) NA
2007 C.D. Huebner 193
Comparison of the related vegetation variables—herbs, shrubs, and
vines. The mixed-model repeated measures analysis of the herb, vine,
and shrub data showed that the methods were significantly different without
any forest and method interactions for richness (F = 128, df = 3, P < 0.001),
number of invasive exotics (F = 4.56, df = 3, P = 0.018), native invasives
(F = 3.41, df = 3, and P = 0.043), and number of natives (F = 108, df = 3, P =
< 0.001). The timed-meander method showed significantly higher herb,
shrub, and vine richness than the systematic (P < 0.001), random (P = 0.016),
modified Whittaker (P = 0.001) methods, but the random method also had
significantly higher richness than the systematic (P = 0.022) and modified
Whittaker methods (P = 0.003) (Table 2). There were significantly more
exotic invasive herbs, shrubs, and vines found using the timed-meander
method compared to the systematic (P = 0.008), random (P = 0.012), and
modified Whittaker (P = 0.007) methods. More native invasive herb, shrub,
and vine species were found using the timed-meander method than the
systematic (P = 0.021) and modified Whittaker (P = 0.021) methods.
Comparison of the related vegetation variables: tree seedlings. The
mixed-model repeated-measures analysis results for the tree-seedling data
showed that the methods were significantly different without any significant
interactions with forest type for richness (F = 8.81, df = 3, P = 0.031) and
number of native species (F = 82.6, df = 3, P = < 0.001). Tree seedling
richness and the number of native species were significantly lower for the
Table 3. Tree-seedling variable means for all sites by method. Means with different letters are
significantly different ( 0.05). Standard errors are in parentheses. Not applicable (NA)
designates those parameters which cannot be compared due to missing plot measures. Richness
is observed counts of different species. Predicted species is the observed richness adjusted for
sample size. Abundance is the averaged actual percent cover per 1-m2 plot for each site.
Diversity is calculated using Shannon’s index H'. Evenness is H' divided by the natural log of
each site’s observed richness.
Modified Timed
Variables Systematic Random Whittaker meander
Richness 11.3B (1.67) 15.3A (1.17) 13.7AB (1.45) 16.8A (1.17)
Exotic invasives
Number 0.17 (0.17) 0.17 (0.17) 0.17 (0.17) 0.33 (0.21)
Abundance 0.011 (0.011) 0.0015 (0.0015) 0.0060 (0.0060) NA
Exotics 0 0 0 0
Native invasives 0 0 0 0
Native weeds
Number 3.3 (0.56) 3.7 (0.21) 3.2 (0.31) 3.5 (0.34)
Abundance 0.31 (0.064) 0.44 (0.12) 0.50 (0.10) NA
Natives
Number 7.83B (1.38) 11.3A (1.20) 10.3AB (1.48) 13.0A (1.24)
Abundance 1.13 (0.470) 1.26 (0.433) 1.25 (0.263) NA
Predicted species 16.3 (3.07) 18.3 (1.28) 20.6 (2.42) NA
Diversity 1.9 (0.15) 2.1 (0.12) 2.2 (0.13) NA
Evenness 0.78 (0.04) 0.78 (0.03) 0.84 (0.04) NA
Percent empty plots 40.6 (7.96) 38.9 (8.08) 38.1 (5.73) NA
194 Northeastern Naturalist Vol. 14, No. 2
systematic method compared to the timed-meander (P = 0.011, P = < 0.001,
respectively) and random (P = 0.022, P = 0.008, respectively) methods
(Table 3).
Which method best describes plant species relative abundance (i.e.,
relative importance) and, consequently, may monitor vegetation change
(i.e., invasion) more accurately?
Overview of species relative abundance. In each forest type, the methods
differed in what they revealed to be the most important species (Appendix
1). The oak forests showed less dissimilarity of important species among
the methods than the hemlock forests. While Dennstaedtia punctilobula was
the most important species of hemlock forests using the random method,
Dryopteris marginalis (marginal wood fern) and Chimaphila maculata
(spotted wintergreen) were the most important using the systematic and
modified Whittaker methods, respectively. The most important species for
the timed-meander method in hemlock forests could be any of 14 species,
but D. marginalis was not among these. The random and modified Whittaker
methods shared Vaccinium pallidum (low-bush blueberry) as their most
important species in oak forests, while the systematic method had D.
punctilobula as its most important species. Both species were among the
highest ranking species for the timed-meander method.
Comparison of the related vegetation variables: herbs, vines, and
shrubs. The mixed-model repeated-measures analysis of the herb, vine,
and shrub data showed that the methods were significantly different without
any forest and method interactions for diversity (F = 15.2, df = 2, P = 0.014)
and predicted number of species (F= 14.4, df = 2, P = 0.015) (Table 2). The
systematic method had significantly higher native weed species abundance
values than the modified Whittaker method, but this was only within oak
forests (i.e., there was a significant forest interaction). Diversity of herbs,
shrubs, and vines was significantly greater for the random and modified
Whittaker methods compared with the systematic method (P = 0.009 and P =
0.034, respectively). The random method had significantly more predicted
herb, shrub, and vine species than the systematic method (P = 0.024),
surpassing the actual number (65) found by the timed-meander method
(Table 2) and coming closest to the total number of species found (236; not
averaged by site) for all methods.
The species-log area model for the modified Whittaker method
(Stohlgren et al. 1997a, c) comparatively underestimated the possible number
of species (i.e., it predicted an average of 48.3 herb, shrub, and vine
species for 2 ha using all sites, 52.1 for hemlock sites, and 44.5 for red oak
sites). Consequently, this method was not viewed as any more reliable than
the first-order jackknife estimator, and the use of various species-area curve
models to compare the four methods was not justified. The first-order
jackknife estimated values for predicted number of herb, shrub, and vine
species in the modified Whittaker method was most similar to the actual
2007 C.D. Huebner 195
richness values of the timed-meander method (i.e., 59.8 for all sites, 67.5
species for hemlock sites, and 52.1 species for red oak sites). Based on the
species area curves, only 22 1-m2 plots, instead of 60, were needed to
achieve the same richness for the herbs, shrubs, and vines using the random
method, while the systematic and modified Whittaker methods required 21
(instead of 32) and 9 (instead of 14), respectively.
Comparison of the related vegetation variables tree seedlings. The
mixed-model repeated-measures analysis results for the tree-seedling data
showed that the methods were not significantly different, with no significant
interactions with forest type for any of the abundance or plot area
variables (Table 3). The species-area curve showed that 25, 34, and 11
plots, instead of 32, 60, and 14 plots, were needed to reach the predicted
species richness of the systematic, random, and modified Whittaker methods,
respectively.
Discussion
Which method best detects exotic invasive species and defines a true
composition or flora?
The timed-meander method and, to a lesser extent, the random method
resulted in the highest estimates of species and, thus, best defined the flora
and invasive exotic species of each site for herbs, vines, shrubs, and tree
seedlings; however, the random method required much more effort. If the
management goals of a site require only documentation of all species
present and information on the relative abundance of such species is not
important, the timed-meander method is the best of the four methods.
These results are well supported by other floristic studies (Goff et al. 1982,
Palmer 1995, Palmer et al. 1995). These two methods may sample the
edges of the sites more effectively than the centrally based systematic-plot
and modified Whittaker methods. However, most of the exotic species
found in the sites were located throughout the sites’ interiors and were
often associated with canopy gaps.
Because of the inherent patchiness of forest understory vegetation
(Beatty 2003), sampling a larger percentage of a site will logically result in
better detection of the less common species. Despite their small size, the
sites’ understories (especially those of the hemlock forests) were heterogeneous
compared to their overstories, which is supported by other studies in
which sites were subjected to intermediate levels of disturbance (Sagers and
Lyon 1997, Williams et al. 1999). However, it is important to point out that
while the timed-meander method tended to detect more species of all species
categories than any other method, it (like each of the other methods) did not
detect all known species in each site. Species that were detected by one of
the other three methods, but missed by the timed-meander method, included
some sedges and grasses, which may have been more difficult to see while
walking as opposed to bending over a plot at ground level. However, small
196 Northeastern Naturalist Vol. 14, No. 2
stature does not explain why the relatively large Epipactis helleborine was
missed in the oak sites by both the timed-meander and modified Whittaker
methods. The relatively dense ground cover in the oak sites may have
influenced detection ability of the timed-meander method. The results of the
timed meander could potentially vary greatly among data collectors if botanical
skill level varies. In order for this method to be effective, those
conducting the timed meander should be skilled field botanists who are
already familiar with the site’s flora. This condition may limit the timedmeander
method’s applicability.
The methods generated significantly different species compositions
(e.g., a different flora) in the hemlock forests, but not in the oak forests,
which suggests that forest type or degree of disturbance may influence the
effectiveness of a sampling method in terms of documenting accurate composition.
It is well-supported that a sampling design should reflect the
vegetation structure (Bonham 1989, Chambers and Brown 1983, Elzinga et
al. 2001, Kent and Coker 1992, Ohmann 1973). However, sampling-design
choice often does not factor in additional disturbance-related factors that
impact the vegetation structure and influence light, water, or nutrient availability.
Given the depauperate understory of healthy hemlock forests
(Hadley 2000, Orwig and Foster 1998), these results either reflect potential
sampling weaknesses in previous studies of healthy hemlock forests or how
hemlock forest understories compositions have changed in response to an
overstory disturbance (i.e., adelgid infestations). In this study, two exotic
species, Rumex acetosella and Ailanthus altissima, were more likely to
invade the hemlock forests than the red oak forests. Both of these species
show greater competitive ability in poor soils and may, in the case of R.
acetosella, prefer such soils (Banasova 1989, Hu 1979, Kowarik 1995). The
invasion or colonization of all these sites by both exotic and native species is
still sparse and patchy, resulting in a very heterogeneous understory. The
timed-meander and random methods were the best at detecting species of all
categories in such a heterogeneous understory. Forest understories, in
general, may become more heterogeneous as larger areas respond to new
invasive insects and pathogens in conjunction with natural and anthropogenic
overstory tree removals, and sampling designs ideally should be able
to document these responses effectively.
Although the modified Whittaker method sampled 5% of each site, it was
not able to detect as many native species as the random method, which only
sampled 0.7% of each site. In this case, sampling a greater percentage of the
area did not result in greater detection ability. The centrally based design of
this method appeared to have missed several patches of native species at
each site.
The random method’s greater sampling intensity may explain its ability
to detect more species. Approximately half of the 60 plots were
needed to achieve the 49.5 herb, shrub, and vine species richness and
2007 C.D. Huebner 197
15.3 tree-seedling species richness based on the species-area curves. This
suggests that the two scales (1 m2 and 10 m2) used may be more important
than the number of plots. The smaller plot size is best suited for the
patches of vegetation that are relatively dense, while the larger plots are
more likely to detect species in widely spaced vegetation (Chambers and
Brown 1983, Mosley et al. 1989), and the forests sampled (especially the
hemlock forests) in this study have both types of understory vegetation
patterns. Thus, these results support the use of variable plot sizes to
increase intensity, instead of increasing the number of plots (Barnett and
Stohlgren 2003, Frischknecht 1981, Stohlgren et al. 1997a).
Which method best describes plant species relative abundance (i.e.,
relative importance) and, consequently, may monitor vegetation change
(i.e., invasion) more accurately?
Because the random method, of the four methods, estimated species cover
from a larger area than the systematic and modified Whittaker methods, and it
predicted more species (based on species-area curves) than the systematic
method, I infer that it came closer to defining true diversity, evenness, and
species abundance. While the modified Whittaker method sampled 5% of
each site, only 0.05% occurred in plots in which species percent cover was
estimated. The timed-meander method is clearly limited in its ability to detect
changes in species abundance and their relative importance because of its
reliance on presence-absence data. The modified Whittaker method showed
lower abundance values of native invasive and native weedy herb, vine, and
shrub species compared to the random and systematic methods. This is not too
surprising considering many relatively abundant species in the larger modified
Whittaker plots were arbitrarily given a small cover estimate when all
plots were standardized to 1 m2. The ten 1-m2 plots, on which cover was
measured, failed to document the importance of some of the dominant species
within the native invasives and native weeds categories when compared to the
random method.
The exotic invasives and exotics were low in abundance, so that differences
were statistically difficult to detect. While invasion has occurred in
both forest types of the DWGNRA, invasion is still in the establishment
stage because few invasive exotic plants make the top 20 most important
species in any of the methods (Appendix 1). One or a few of the currently
rare species could be sampled more effectively using adaptive cluster sampling
or two-stage sampling (Elzinga 2001; Thompson 1991, 1994), but
these methods are not suitable for community-level studies. If abundance of
the invasive exotic species increases over time with a subsequent decrease in
abundance of associated native species, the random method will be the best
of the four methods to capture this change. It is expected that the exotic
invasive species will behave much like the native weeds in response to
disturbances and changes in resource availability (Attiwill and Adams 1993,
Boring et al. 1981, Gilliam 2002, Phillips and Shure 1990). Consequently,
198 Northeastern Naturalist Vol. 14, No. 2
the tendency for the systematic method to overestimate the abundance of
native weeds, at least in oak forests, and the modified Whittaker method to
underestimate their abundance and importance when compared to the
random method, is of concern. The native species showed no significant
difference in abundances estimated by each method because most of the
native species were relatively rare.
The random method’s greater sampling intensity may place more credence
on its estimate of species abundance. Moreover, inclusion of a larger
plot size also ensures a more accurate measure of larger vegetation such as
shrubs, vines, and highly clonal perennial herbs. The modified Whittaker
method is also composed of multiple scales and did comparatively well in
estimating richness, but its abundance estimates and importance values are
based on a much smaller sample area compared to the random method.
Consequently, this method, which has been suggested as a standard sampling
method (Barnett and Stohlgren 2003; Chong et al. 2001; Stohlgren et
al. 1995, 1997b), is considered unsuitable for monitoring. However, modifications
of the modified Whittaker method, such as estimating cover in the
10-m2 plots, using two (or more) 1000-m2 areas instead of one (indeed,
Stohlgren et al. [1997a] suggests using one modified Whittaker plot per
actual 1000 m2 of area), and adding more 1-m2 and 10-m2 plots, may result in
vegetation variable estimates similar to that of a combined random and
timed-meander approach. These changes would increase the effort required
considerably. Also, some areas may be of a shape not conducive to the
modified Whittaker plot layout. In contrast, the random method can be
manipulated by dissecting the transect to fit existing land forms, being
careful to avoid overlap of plots.
If plots of a different scale were added to the systematic plot design, it may
perform more similarly to the random method in terms of species abundances.
However, there is an additional benefit to the random method shared by the
timed-meander method in that permanent plot establishment is not required
for monitoring. Choosing random plots each sampling period predictably will
increase the variance (i.e., decrease the sampling precision), possibly requiring
that all 60 plots (or more) always be sampled. Nonetheless, the cost and
effort associated with maintaining the permanent plots over a long period may
make sampling more random plots worthwhile. If colonization by new species
is occurring and changes in species cover or composition is expected, i.e.,
after a disturbance event, the relative precision of permanent plots may
decrease. Maintenance of the permanent plots may not be warranted with very
weak year-to-year plot correlations. Permanent plots are also more likely to
suffer from impacts caused by data collectors, who make repeated visits to the
plots, or wildlife attracted to the markers (Elzinga et al. 2001).
Conclusions
A standard method of sampling vegetation for both detection and monitoring
needs to be both flexible and intensive enough to address differences
2007 C.D. Huebner 199
in patterns of various forest types. Combining the random method and the
timed-meander method ensures that most species will be found and that
vegetation patterns are detected; these are proposed as potential standard
sampling methods.
The results of this study indicate that four sampling methods used to
evaluate the same area produce four different results. While it is comforting
to know that overall compositional differences among the methods were
insignificant in one of the two forest types, conclusions that one would make
about the most important exotic invasive species (or species in general),
richness, number and abundance of natives and exotics, diversity, and evenness
would differ depending on the method employed. If the goal is solely to
detect the presence of invasive exotic species (or all species), the timedmeander
method (or a similar method) is most suitable. However, detection is
rarely sufficient when evaluating success or failure of control strategies and
management or impacts of invasion. Such assessments require monitoring,
and the random method (or a method of similar intensity) is the strongest for
estimating changes in relative abundance. Consequently, an initial combined
effort of the timed-meander and random methods, followed by subsequent
monitoring using the random method, is most prudent. If significant changes
in composition are suspected (i.e., after a disturbance or environmental stress
event), it is advisable to use the timed-meander method periodically to assess
the detection strength of the random method.
Acknowledgments
Funding was provided by the USDA Forest Service’s Director’s Initiative Grant
Project. I thank Todd Ristau, Todd Hutchinson, and Gary Wade for their advice and
collaboration, as well as Heather Smith and Tim Block for their field assistance. I
also thank the National Park Service, in particular Rich Evans, Larry Hilaire, Craig
Thompson, and Cathy Halainen, for providing assistance. I finally thank Dave
Gorchov and two anonymous reviewers for their editorial suggestions.
Literature Cited
Austin, M.P. 1999. A silent clash of paradigms: Some inconsistencies in community
ecology. Oikos 86:170–178.
Austin, M.P., and P.C. Heyligers. 1989. Vegetation survey design for conservation:
Gradsect sampling of forests in North-eastern New South Wales. Biological
Conservation 50:13–32.
Attiwill, P.M., and M.A. Adams. 1993. Tansley review no. 50. Nutrient cycling in
forests. New Phytologist 124:561–582.
Banasova, V. 1989. Relation of plant species to the pH of the soil on mine heaps.
Ekologia-CSSR 8(2):117–122.
Barnes, B.V., K.S. Pregitzer, T.A. Spies, and V.H. Spooner. 1982. Ecological forest
site classification. Journal of Forestry 80:493–498.
Barnett, D.T., and T.J. Stohlgren. 2003. A nested-intensity design for surveying
plant diversity. Biodiversity and Conservation 12:255–278.
200 Northeastern Naturalist Vol. 14, No. 2
Beatty, S.W. 2003. Habitat heterogeneity and maintenance of species in understory
communities. Pp. 177–197, In F.S. Gilliam and M.S. Roberts (Eds.). The Herbaceous
Layer in Forests of Eastern North merica. Oxford University Press, New
York, NY. 408 pp.
Bonham, C.D. 1989. Measurements for Terrestrial Vegetation. Wiley-Interscience,
New York, NY. 338 pp.
Boring, L.R., C.D. Monk, and W.T. Swank 1981. Early regeneration of a clear-cut
Southern Appalachian forest. Ecology 62:1244–1253.
Chambers, J.C., and R.W. Brown. 1983. Methods for vegetation sampling and
analysis on revegetated mined lands, General Technical Report INT 151. Intermountain
Forest and Range Experiment Station, USDA Forest Service, Ogden,
UT. 57 pp.
Chiarucci, A., S. Maccherini, and V. de Dominicis. 2001. Evaluation and monitoring
of the flora in a nature reserve by estimation methods. Biological Conservation
101:305–314.
Chong, G.W., R.M. Reich, M.A. Kalkhan, and T.J. Stohlgren. 2001. New approaches
for sampling and modeling native and exotic plant species richness. Western
North American Naturalist 61(3):328–335.
de la Cretaz, A.L., and M.J. Kelty. 1999. Establishment and control of hay-scented
fern: A native invasive species. Biological Invasions 1:233–236.
Dewey, S.A., and K.A. Andersen. 2004. Distinct roles of surveys, inventories, and
monitoring in adaptive weed management. Weed Technology 18:1449–1452.
Elzinga, C.L., D.W. Salzer, J.W. Willoughby, and J.P Gibbs. 2001. Monitoring Plant
and Animal Populations. Blackwell Science, Inc, Malden, MA. 360 pp.
Etchberger, R.C., and P.R. Krausman. 1997. Evaluation of five methods for measuring
desert vegetation. Wildlife Society Bulletin 25(3):604–609.
Fernald, M.L. 1970. Gray’s Manual of Botany. D Van Nostrand, New York, NY.
1632 pp.
Frischknecht, N.C. 1981. Double-frequency sampling for inventorying vegetation on
salt desert shrub ranges. In H.G. Lund, M. Caballero, R.H. Hamre, R.S. Driscoll,
W. Bonner (Eds.) Arid land resource inventories: developing cost efficient methods.
General Technical Report WO-28. Department of Agriculture, Forest Service,
Washington, DC. 435–440 pp.
Gilliam, F.S. 2002. Effects of harvesting on herbaceous-layer diversity on a Central
Appalachian hardwood forest in West Virginia, USA. Forest Ecology and Management
155:33–43.
Gleason, H.A., and A. Cronquist. 1991. Manual of the Vascular Plants of Northeastern
United States and Adjacent Canada, 2nd. Edition. The New York Botanical
Garden, Bronx, NY. 910 pp.
Goff, F.G., G.A. Dawson, and J.J. Rochow. 1982. Site examination for threatened
and endangered plant species. Environmental Management 6(4):307–316.
Hadley, J.L. 2000. Understory microclimate and photosynthetic response of saplings
in an old-growth eastern hemlock (Tsuga canadensis L.) forest. Ecoscience
7(1):66–72.
Harmon, P.J. 1999. Checklist of the invasive plant species of West Virginia. West
Virginia Native Plant Society, Elkins, WV. 25 pp.
Helm, D.J., and B.R. Mead. 2003. Reproducibility of vegetation-cover estimates in
south-central Alaska forests. Journal of Vegetation Science 14:33–40.
2007 C.D. Huebner 201
Hill, J.D., and J.A. Silander, Jr. 2001. Distribution and dynamics of two ferns:
Dennstaedtia punctilobula (Dennstaedtiaceae) and Thelypteris noveboracensis
(Thelypteridaceae) in a Northeast mixed hardwoods-hemlock forest. American
Journal of Botany 88(5):894–902.
Hobbs, R.J., and L.F. Huenneke. 1992. Disturbance, diversity, and invasion: Implications
for conservation. Conservation Biology 6(3):324–337.
Hu, S.Y. 1979. Ailanthus. Arnoldia 39(2):29–50.
Invasive Plant Council of New York State. 2003. Primary list of invasive plants in
New York State. Available online at http://www.ipcnys.org/pages/
top%2020.htm. Accessed August 2003.
Kent, M., and P. Coker. 1992. Vegetation Description and Analysis. John Wiley and
Sons, New York, NY.
Kercher, S.M., C.B. Frieswyk, and J.B. Zedler. 2003. Effects of sampling teams and
estimation methods on the assessment of plant cover. Journal of Vegetation
Science 14:899–906.
Kowarik, I. 1995. On the role of alien species in urban flora and vegetation. Pp. 85–
103, In P. Pysek, K. Prach, M. Rajmanek, and M. Wade (Eds.). Plant Invasions:
General Aspects and Special Problems SPB. Academic Publishing, Amsterdam,
The Netherlands. 263 pp.
Littell, R.C., P.R. Henry, and C.B. Ammerman. 1998. Statistical analysis of repeated
measures using SAS procedures. Journal of Animal Science 76:1216–1231.
Lonsdale, W.M. 1999. Global patterns of plant invasions and the concept of
invasibility. Ecology 80(5):1522–1536.
Luken, J.O. 2003. Invasions in Forests in the Eastern United States. Pp. 281–301, In
F.S. Gilliam and M.S. Roberts (Eds.). The Herbaceous Layer in Forests of
Eastern North America. Oxford University Press, New York, NY. 408 pp.
McAvoy, W.A. 2001. Invasive plant species in Delaware. Delaware Department of
Natural Resources and Environmental Control, Division of Fish and Wildlife,
Natural Heritage Program. Available online at http://www.udel.edu/DISC/. Accessed
September 2002.
McCune, B., and M.J. Mefford. 1999. PC-ORD Multivariate Analysis of Ecological
Data, Version 4. MjM Software Design, Gleneden Beach, OR. 237 pp.
Mosley, J.C., S.C. Bunting, and M. Hironaka. 1989. Quadrad and sample sizes for
frequency sampling mountain meadow vegetation. Great Basin Naturalist
49(2):241–248.
Myers, W.L., and R.R. Irish. 1981. Vegetation survey of Delaware Water Gap
National Recreation Area: Final report. USDI National Park Service, Mid-Atlantic
Region, Milford, PA. CD-ROM of database.
Native Plant Society of New Jersey. 2003. References: Invasive plant species.
Available online at http://www.npsnj.org/invasive_species_013.htm. Accessed
August 2003.
Ohmann, L.F. 1973. Vegetation data collection in temperate forest research natural
areas. USDA Forest Service Research Paper NC-92. North Central Forest Experiment
Station. United States Forest Service, St. Paul, MN.
Orwig, D.A., and D.R. Foster. 1998. Forest response to the introduced hemlock
woolly adelgid in southern New England, USA. Journal of the Torrey Botanical
Society 125(1):60–73.
202 Northeastern Naturalist Vol. 14, No. 2
Palmer, M.W. 1995. How should one count species? Natural Areas Journal
15(2):124–135.
Palmer, M.W., G.L.Wade, and P. Neal. 1995. Standards for the writing of floras.
BioScience 45(5):339–345.
Pedan, A. 2003. Smoothing with SAS Proc Mixed. Seattle SAS Users Group International
Proceedings March 30–April 2. SAS, Inc., Cary, NC. Available online at
http://www2.sas.com/proceedings/sugi28/TOC28.pdf. Accessed October 2004.
Peet, R.K., T.R. Wentworth, and P.S. White. 1998. A flexible, multipurpose method
for recording vegetation composition and structure. Castanea 63(3):262–274.
Pennsylvania Department of Conservation and Natural Resources. 2000. Invasive
plants in Pennsylvania. Available online at http://www.dcnr.state.pa.us/forestry/
wildplant/serious.htm. Accessed September 2002.
Phillips, D.L., and D.J. Shure. 1990. Patch-size effects on early succession in
Southern Appalachian forests. Ecology 71:204–212.
Rhoads, A.F., and T.A. Block. 2000. The Plants of Pennsylvania: An Illustrated
Manual. University of Pennsylvania Press, Philadelphia, PA. 1061 pp.
Royle, D.D., and R.G. Lathrop. 1997. Monitoring hemlock forest health in New
Jersey using Landsat TM data and change detection techniques. Forest Science
43(3):327–335.
Sagers, C.L., and J. Lyon. 1997. Gradient analysis in a riparian landscape: Contrasts
among forest layers. Forest Ecology and Management 96:13–26.
Sardinero, S. 2000. Classification and ordination of plant communities along an
altitudinal gradient on the Presidential Range, New Hampshire, USA. Plant
Ecology 148:81–103.
Shmida, A. 1984. Whittaker’s plant-diversity sampling method. Israel Journal of
Botany 33:41–46.
Spurr, S.H., and B.V. Barnes. 1980. Forest Ecology. John Wiley and Sons, New
York, NY. 687 pp.
Stohlgren, T.J., M.B. Falkner, and L.D. Schell. 1995. A modified-Whittaker nestedvegetation
sampling method. Vegetatio 117:113–121.
Stohlgren, T.J., G.W. Chong, M.A. Kalkhan, and L.D. Schell. 1997a. Multiscale
sampling of plant diversity: Effects of minimum mapping unit size. Ecological
Applications 7(3):1064–1074.
Stohlgren, T.J., G.W. Chong, M.A. Kalkhan, and L.D. Schell. 1997b. Rapid assessment
of plant diversity patterns: A methodology for landscapes. Environmental
Monitoring and Assessment 48:25–43.
Stohlgren, T.J., M.B. Coughenour, G.W. Chong, D. Binkley, M.A. Kalkhan, L.D.
Schell, D.J. Buckley, and J.K. Berry. 1997c. Landscape analysis of plant diversity.
Landscape Ecology 12:155–170.
Stohlgren, T.J., K.A. Bull, and Y. Otsuki. 1998. Comparison of rangeland vegetation
sampling techniques in the central grasslands. Journal of Range Management
51(2):164–172.
Stokes, C.J., and R.I. Yeaton. 1994. A line-base vegetation sampling technique and its
application in succulent karoo. African Journal of Range and Forest Science
11(1):11–17.
Taylor, J.A., G.R. Friend, and M.L. Dudzinski. 1984. Influence of sampling strategy
on the relationships between fauna and vegetation structure, plant-life form, and
floristics. Australian Journal of Ecology 9:281–287.
2007 C.D. Huebner 203
Thompson, S.K. 1991. Stratified adaptive cluster sampling. Biometrika 78:389–397.
Thompson, S.K. 1994. Detectability in conventional and adaptive sampling. Biometrics
50:712–724.
USDA Forest Service, Eastern Region. 1998. Section 3B. Eastern region invasive
plants, ranked by degree of invasiveness as based on information from states.
Available online at http://www.fs.fed.us/r9/wildlife/range/weed/?open
=Sec3A.htm. Accessed September 2002.
van Tongeren, O.F.R. 1987. Similarity and dissimilarity. Pp. 176–180, In R.H.G.
Jongman, C.J.F. ter Braak, and O.F.R. van Tongeren (Eds.). Data Analysis in
Community and Landscape Ecology. Centre for Agricultural Publishing and
Documentation (Pudoc), Wageningen, The Netherlands. 299 pp.
Virginia Department of Conservation and Recreation and Virginia Native Plant
Society. 2001. Invasive alien plant species of Virginia. Available online at http:/
/dcr.state.va.us/dnh/pdflist.htm. Accessed September 2002.
Williams, C.E., W.J. Moriarity, G.L. Walters, and L. Hill. 1999. Influence of inundation
potential and forest overstory on the ground-layer vegetation of Allegheny
Plateau riparian forests. American Midland Naturalist 141:323–338.
Yorks, T.E., and S. Dabydeen. 1998. Modification of the Whittaker sampling technique
to assess plant diversity in forested natural areas. Natural Areas Journal
18(2):185–189.
Yorks, T.E., D.J. Leopold, and D.J. Raynal. 2001. Potential biogeochemical and
vegetative consequences of an invasive insect herbivore in Tsuga canadensis
stands. Ecological Society of America Annual Meeting Abstracts 86:241–242.
Young, J.A., D.R. Smith, C.D. Snyder, and D.P. Lemarie. 2002. A terrain-based
paired-site sampling design to assess biodiversity losses from eastern hemlock
decline. Environmental Monitoring and Assessment 76:167–183.
204 Northeastern Naturalist Vol. 14, No. 2
Appendix 1. The top 20 most important herb, shrub, and vine species and top 10 treeseedling
species pooled for all three sites in each forest type and within each method.
* = exotic; ** = invasive exotic; + = native invasive; ++ = native weed (or early
successional/gap species); no mark = native exclusive of the other categories. A dash
is used to indicate that a species was not present in the top 20. The highest rank is “1.”
Equivalent ranks within a method are possible and occur more often within the
timed-meander method. S = systematic, R = random, MW = modified Whittaker, T-m
= timed meander.
Eastern Hemlock Forest – Herbs, Shrubs, and Vines
Species S R M-W T-m
Dryopteris marginalis (L.) A. Gray. (marginal fern) 1 - - 2
Eupatorium rugosum Houttuyn. (white snakeroot) 2 - 5 1
*Verbascum thapsus L. (common mullein) 3 - - -
Osmunda claytoniana L. (interrupted fern) 4 - 12 -
Vaccinium L. sp. (blueberry) 5 - - -
Potentilla simplex Michx. (old-field cinquefoil) 6 - - -
Collinsonia canadensis L. (northern horse-balm) 7 - - -
*Epipactis helleborine (L.) Crantz. (helleborine) 8 13 12 -
Aster puniceus L. ssp.firmus (Nees) A.G. Jones. 9 - - -
(bristly aster)
Plantago L. sp. (plantain) 10 - - -
Carex cephalophora Muhl. (sedge) 11 - - -
Rubus L. sp. (bramble) 12 - - -
Carex festucacea Schk. (sedge) 13 - - -
Monotropa uniflora L. (Indian pipe) 13 - - 1
++Phytolacca americana L. (pokeweed) 14 16 12 -
Osumunda cinnamomea L. (cinnamon fern) 15 - - -
Carex L. sp. (sedge) 16 - - -
+Thelypteris noveboracensis (L.) Nieuwl. (New York fern) 17 - - -
Vaccinium angustifolium Aiton. (lowbush blueberry) 17 8 - -
Tiarella cordifolia L. (foam flower) 18 - - -
Dennstaedtia punctilobula (Michx.) Moore. - 1 7 1
(hayscented fern)
Vaccinium stamineum L. (deerberry) - 2 4 -
Vaccinium pallidum Aiton. (hillside blueberry) - 3 2 1
Carex pensylvanica Lam. (sedge) - 4 3 1
Mitchella repens L. (partridge berry) - 5 10 1
Polystichum acrostichoides (Michx.) Schott. - 6 11 2
(Christmas fern)
++Erechtites hieraciifolia (L.) Raf. (fireweed) - 7 12 2
Chimaphila maculata (L.) Pursh. (spotted wintergreen) - 9 1 1
Diphasiastrum digitatum (Dill. Ex A. Braun) Holub. - 10 - -
(ground cedar)
Carex striatula Michx. (sedge) - 11 - -
Dryopteris intermedia (Muhl.) A. Gray. (wood fern) - 12 12 2
Aster divaricatus L. (white heart-leaved aster) - 14 12 1
Viola blanda Willd. (sweet white violet) - 15 - -
Carex swanii (Fern.) Mackenzie (sedge) - 17 - -
Carex bromoides Willd. (sedge) - 18 - -
Solidago caesia L. (blue-stemmed goldenrod) - 19 - -
Panicum acuminatum Sw. (panic grass) - 20 - -
2007 C.D. Huebner 205
Species S R M-W T-m
Carex digitalis Willd. (sedge) - - 6 -
Maianthemum canadense Desf. (Canada mayflower) - - 7 1
**Berberis thunbergii DC. (Japanese barberry) - - 8 -
Parthenocissus quinquefolia (L.) Planchon. - - 9 1
(Virginia creeper)
Hamamelis virginiana L. (witchhazel) - - 10 -
+Vitis L. sp. (grape) - - 10 1
**Alliaria petiolata (Bieb.) Cavara & Grande - - - 1
(garlic mustard)
**Microstegium vimineum (Trin.) A. Camus - - - 1
(Japanese stiltgrass)
+Toxicodendron radicans (L.) Kuntze. (poison ivy) - - - 1
Deschampsia flexuosa (L.) Trin. (hairgrass) - - - 2
Polygonatum pubescens (Willd.) Pursh. (Solomon’s seal) - - - 2
Red-Oak Dominated Forest – Herbs, Shrubs, and Vines
Species S R M-W T-m
+Dennstaedtia punctilobula (Michx.) Moore. 1 2 8 1
(hayscented fern)
Vaccinium stamineum L. (deerberry) 2 3 3 -
+Thelypteris noveboracensis (L.) Nieuwl. (New York fern) 3 12 - -
Polystichum acrostichoides (Michx.) Schott. 4 6 13 -
(Christmas fern)
Deschampsia flexuosa (L.) Trin. (hairgrass) 5 5 4 1
Vaccinium pallidum Aiton. (hillside blueberry) 6 1 1 1
Gaylussacia baccatta (Wangenh.) K. Koch. (huckleberry) 7 4 2 -
Osmunda cinnamomea L. (cinnamon fern) 8 14 - -
Osmunda claytoniana L. (interrupted fern) 9 - - -
Chimaphila maculata (L.) Pursh. (spotted wintergreen) 10 7 6 1
Podophyllum peltatum L. (mayapple) 11 8 15 -
Aralia nudicaulis L. (sarsaparilla) 12 - - 1
Mitchella repens L. (partridge berry) 13 - - -
Maianthemum canadense Desf. (Canada mayflower) 14 13 12 -
Eupatorium rugosum Houttuyn. (white snakeroot) 15 - - 1
Rubus flagellaris Willd. (northern dewberry) 16 18 10 -
**Anthoxanthum odoratum L. (sweet vernal grass) 17 - - -
+Toxicodendron radicans (L.) Kuntze. (poison ivy) 18 16 - 1
+Pteridium aquilinum (L.) Kuhn. (bracken fern) 19 - - -
Quercus ilicifolia Wangenh. (bear oak) 19 - - -
Viburnum acerifolium L. (maple-leaf viburnum) - 9 9 1
Lindera benzoin (L.) Blume. (spice bush) - 10 - -
Parthenocissus quinquefolia (L.) Planchon. - 11 - 1
(Virginia creeper)
Carex pensylvanica Lam. (sedge) - 11 5 1
Desmodium nudiflorum (L.) DC. (naked tick-trefoil) - 15 15 1
Vaccinium angustifolium Aiton. (lowbush blueberry) - 17 7 -
Carex L. sp. (sedge) - 17 - -
Carex cephalophora Muhl. (sedge) - - 11 -
Carex digitalis Willd. (sedge) - - 14 -
Uvularia perfoliata L. (bellwort) - - 16 -
Cypripedium acaule Aiton. (pink lady-slipper) - - 17 -
206 Northeastern Naturalist Vol. 14, No. 2
Species S R M-W T-m
**Berberis thunbergii DC. (Japanese barberry) - - 18 -
Carex swanii (Fern.) Mackenzie (sedge) - - 18 1
**Alliaria petiolata (Bieb.) Cavara & Grande - - - 1
(garlic mustard)
Galium circaezans Michx. (wild licorice) - - - 1
**Microstegium vimineum (Trin.) A. Camus - - - 1
(Japanese stiltgrass)
Monotropa uniflora L. (Indian pipe) - - - 1
Polygonatum biflorum (Walter) Elliott. (Solomon’s seal) - - - 1
Potentilla simplex Michx. (old-field cinquefoil) - - - 1
*Veronica officinalis L. (common speedwell) - - - 1
+Vitis L. sp. (grape) - - - 1
Eastern Hemlock Forests – Tree Seedlings
Species S R M-W T-m
++Betula L. sp. (birch) 1 2 - -
Carpinus caroliniana Walter. (blue beech) 2 6 3 -
++Acer rubrum L. (red maple) 3 1 4 1
Tsuga canadensis (L.) Carrière (eastern hemlock) 4 4 8 1
++Prunus serotina Ehrh. (black cherry) 5 9 6 1
Quercus montana Willd. (chestnut oak) 6 3 1 2
Amelanchier arborea (Michx. f.) Fern. (serviceberry) 7 7 5 1
Quercus rubra L. (northern red oak) 8 8 2 -
Quercus alba L. (white oak) 9 - - 1
++Liriodendron tulipifera L. (tulip poplar) 10 - 10 -
++Betula lenta L. (sweet birch) - 5 7 -
Carya glabra (Miller) Sweet. (pignut hickory) - 10 9 1
Acer saccharum Marshall. (sugar maple) - - - 1
Fagus grandifolia Ehrh. (American beech) - - - 1
**Ailanthus altissima (Miller) Swingle. (tree of heaven) - - - 2
Red-Oak Dominated Forests — Tree Seedlings
Species S R M-W T-m
Acer saccharum Marshall. (sugar maple) 1 2 1 -
Quercus montana Willd. (chestnut oak) 2 1 3 -
++Acer rubrum L. (red maple) 3 3 2 1
Fraxinus americana L. (white ash) 4 6 9 1
Quercus alba L. (white oak) 5 4 4 -
Quercus rubra L. (northern red oak) 6 8 7 2
Fagus grandifolia Ehrh. (American beech) 7 5 6 1
Amelanchier arborea (Michx. f.) Fern. (serviceberry) 8 9 8 1
Quercus velutina Lam. (black oak) 9 - - 1
++Betula L. sp. (birch) 10 - 5 -
Carya glabra (Miller) Sweet. (pignut hickory) - 7 - -
Ostrya virginiana (Miller) K. Koch. (ironwood) - 10 - 2
Carpinus caroliniana Walter. (blue beech) - - 10 -
Carya Nutt. sp. (hickory) - - - 2
Pinus strobus L. (white pine) - - - 3
++Prunus serotina Ehrh. (black cherry) - - - 3