2006 SOUTHEASTERN NATURALIST 5(3):523–534
Burrow Dispersion of Central Florida Armadillos
Alton Emory Kinlaw*
Abstract - The recent invasion of Dasypus novemcinctus (nine-banded armadillo)
into the southeastern United States has brought it into contact with a native
burrowing chelonian, Gopherus polyphemus (Gopher Tortoise), whose burrows it
usurps. Because the Gopher Tortoise is listed as vulnerable by IUCN (1996),
baseline data on burrows of armadillos might improve our understanding of the
impact of this introduced mammal on this reptile. Armadillo burrows were
counted in a stratified random sample of 4 major habitats at Avon Park Air Force
Range, FL. Data on spatial distributions of the burrows in all habitats fit the
negative binomial distribution, indicating clumping. Burrow density in pine
habitats was more than twice that of oak hammock, sand pine, or oak scrub.
Likelihood-ratio tests combined with Akaike’s Information Criteria showed that
the best model was one in which the dispersion parameter (k) did not vary but the
parameter for the arithmetic mean (m) did.
Introduction
Dasypus novemcinctus Linnaeus (nine-banded armadillo) are very adaptable
mammals (Kays and Wilson 2002) in that they occupy many habitats and
are reported to be increasing their range 4–10 km/yr in the southeastern United
States (Humphrey 1974). Since the 1900s, they have completely invaded
Texas through natural range expansion from Mexico (Davis and Schmidly
1994). Florida armadillos are derived from two sources: introductions in south
Florida (Bailey 1924, Sherman 1936) and recent natural expansions into west
Florida from the west (Humphrey 1974). Presently, they are well established
throughout Florida, with the exception of the wetter parts of the Everglades
(Neill 1952, Taulman and Robbins 1996). Armadillos are commonly associated
with human activity and are one of the most common road-killed
mammals found along Florida’s roadways (Inbar and Mayer 1999).
This recent invasion has brought armadillos into contact with Gopherus
polyphemus Daudin (Gopher Tortoises), large fossorial chelonians that dig
extensive underground burrows in pyrogenic ecosystems of the southeastern
United States. The Florida Fish and Wildlife Commission (FWC) is currently
reclassifying the tortoise from it's present status as a “species of
special concern” to a “threatened” status (FWC 2006a), along with strengthening
protection of its burrows (FWC 2006b). The International Union for
the Conservation of Nature and Natural Resources (IUCN) lists this species
as “vulnerable” to extinction. Although there is no information on what
*Department of Wildlife Ecology and Conservation, 303 Newins-Ziegler Hall, University
of Florida, Gainesville, FL 32611-0430; akinlaw@comcast.net.
524 Southeastern Naturalist Vol. 5, No. 3
impact armadillos have had on this tortoise, the ecology of these two species
are intertwined. Guyer and Hermann (1997) speculated that the availability
of Gopher Tortoise burrows and their subsequent use by armadillos may
have played a role in local armadillo dispersal. Galbreath (1982) observed
that an armadillo was aggressive to a tortoise when the two were confined
together. In view of the tortoises’ decline, data on armadillo habitat-use
patterns is needed to understand better the interaction between the two
species and formulate management plans.
Regional distribution of armadillos in Texas is related to soil texture,
with sandy soil preferred (Taber 1945), and marshy areas of excess water
avoided (Davis and Schmidly 1994). Local distribution of armadillos in
Florida is related to the abundance of the insects they consume, which are in
turn related to rainfall and season (Wirtz et al. 1985).
In this study, I used burrow counts as a metric to measure habitat
occupancy. This is well justified since burrows play a major role in the
functional ecology of this species (Clark 1951). Armadillos use burrows for
thermoregulation (Gause 1980, McNab 1980), predator escape (Breece and
Dusi 1985), and as food traps (Taber 1945). Moreover, an individual armadillo
can save the energy and time required to dig its own burrow by
occasionally usurping a burrow dug by another species. Since they are much
more likely to dig burrows in regularly used habitats within their home range
(McDonough et al. 2000), burrow counts should reflect an accurate measure
of use by armadillos of preferred habitat.
Armadillo burrows are an easily counted animal artifact. Counts of such
biological populations or objects often fit the negative binomial distribution
(NBD; Bliss and Fisher 1953). Although the application of the NBD to
animal populations was described over 30 years ago by Elliott (1971), it has
been underused in practical conservation strategies. A characteristic of the
NBD is that frequencies can decrease monotonically from a modal value of
zero (Pielou 1969), and this may describe the spatial distribution of burrows.
The NBD is described by two parameters: the arithmetic mean (m) and a
dispersion parameter (k).
The use of counts of animal artifacts such as tracks, pellets, nests, or
burrows as a crude index to population size has a long history in wildlife
management (Overton 1971, Sutherland 1996). For the index to be used to
estimate population size, it must be calibrated by determining the relationship
of the true population density with the density of the artifact (Caughley
1977). At the end of the paper, I discuss the issues involved in using burrow
counts as a population index with D. novemcinctus.
Study Area
The Avon Park Air Force Range (APR) is a 42,927-ha military reservation
located in Polk and Highlands counties, FL, and is used as an active
2006 A.E. Kinlaw 525
bombing range. APR consists of a mosaic of upland and wetland communities,
but the major topographic feature is a sand ridge, oriented north to
south, 53.3 m above sea level at the highest point, grading down on the east
and west sides to about 21.3 m above sea level. The ridge is referred to as the
“Bombing Range Ridge,” a classic “drum-stick” barrier island, thought to
have developed during an early Pleistocene marine regression (White 1970).
Methods
This 1997–1998 survey had a stratified random design (Cochran 1963).
A transparent overlay with a grid of numbered squares was applied to a GIS
map of the plant communities of Avon Park, with the scale set so that each
square drawn on the map represented a 1-ha plot in the field. Using a
random-numbers table (Steel and Torie 1980), 55 plots in oak scrub, 53 in
pine flatwoods, 23 in sand pine, and 17 in oak hammock were randomly
selected. No effort was made to detail the activity status (currently used
versus not currently used) of the burrows. The survey did not include a few
habitats that might be used by Dasypus, including managed pine plantations,
cypress, wet-prairie, lake edge, pastures, hardwood swamp forest, or ruderal
sites. The pine flatwoods category combined mesic and scrubby flatwoods.
Each plot was then located in the field and thoroughly searched for both
Gopher Tortoise and armadillo burrows by 1, 2, or occasionally 3 surveyors.
Three criteria were used to distinguish burrows of the armadillo from those
of the Gopher Tortoise. The first criterion was the difference in shape of the
opening: active Dasypus burrows have a vertically ovoid shape, whereas
active Gopherus burrows have a horizontally elliptical (“half-moon”) appearance,
reflecting the body shape of each excavator. Secondly, tortoise
burrows had a considerable “apron” or mound of freshly excavated sand
opposite the entrance; the soil excavated by armadillos was not nearly as
extensive, as they do not usually excavate as much soil, resulting in shallower
burrows. Thirdly, tracks of each species were often found at the
burrows and have fundamentally different shapes. The rounded tortoise
tracks are usually abundant inside the burrow tunnel and at the opening of an
active tortoise burrow, as well as on or around the apron. The “hoof-like”
armadillo tracks are distinctive when seen in soft sand at the opening.
Although armadillos will construct above-ground nests (Layne and
Waggener 1984), these were not sampled in this study.
In analyzing the data, summary statistics included point estimates and
95% confidence intervals for the mean burrow-count per quadrat and the
sample proportion of burrows in each habitat. Confidence intervals for
means were obtained by bootstrapping (Efron and Tibshirani 1986) the
data, rather than using transformations, because the normality assumption
did not hold for these skewed data and because of small sample sizes for
2 of the habitats.
526 Southeastern Naturalist Vol. 5, No. 3
Habitat and burrow counts were tested to see if there was an association
between the two, using Pearson’s chi-square statistic. The odd’s ratio
(probability of success divided by the probability of failure, for one habitat
compared to another habitat) was calculated because it is a useful
statistic investigators could use to compare their chance of success in
similar surveys.
Because no previous field studies had investigated the burrow dispersion
of D. novemcinctus, burrow distribution was plotted to determine whether or
not the burrows were clumped. Since sample size was different for each of
the 4 habitats, I calculated the standardized Morisita index of dispersion
(Smith-Gill 1975), which is independent of density and sample size
(Malhado and Petrere 2004).
Because the graph of the burrow counts (Fig. 1) resembled a negative
binomial, I tested to see if the burrows in each habitat were randomly
arranged (Poisson distribution), or if they had a clumped pattern (such as the
negative binomial distribution). Because the sample sizes for oak scrub,
sand pine, and oak hammock datasets were too small for a chi-squared test
for goodness of fit to show a negative binomial, I used a variance-mean ratio
test for clumped distribution, and either a U or T statistic to test for goodness-
of-fit (GOF). These latter 2 statistics are more precise than the chisquared
test in detecting departures from the theoretical negative binomial
distribution with sample sizes less than 50 (Krebs 1999). The sample size for
pine was large enough to use a chi-squared test to see if the data fit the
negative binomial.
I tested for equality among these different negative binomially distributed
datasets, following the procedure first described by White and
Eberhardt (1980). I began the analysis by testing goodness-of-fit to an
unconstrained general model (i.e., both m and k allowed to vary, model
{kv,mv}) of the negative binomial distribution. This provided a test of
whether the data fit the NBD without the additional constraints introduced
by reducing the number of parameters.
I then used a likelihood-ratio procedure to determine if there were differences
in m, k, or both, using α = 0.05, for populations of the burrows in each
habitat, in the context of the NBD. Since the negative binomial can have
different means (m) or different exponents (k), there were 4 possible outcomes
(White and Eberhardt 1980):
1) each habitat differs in mean and k (model {kv, mv });
2) habitats have common k but different means (model {k, mv});
3) habitats have common mean but different k (model {kv, m}); and
4) all habitats have the same mean and k (model {k, m}).
Likelihood-ratio tests were used to discriminate between these models.
Goodness-of-fit between the observed data and the values expected from a
NBD for each of the 4 models was measured using the log-likelihood G
2006 A.E. Kinlaw 527
statistic (Sokal and Rohlf 1981). Since the Akaike Information Criteria
(AIC) has received wide use in model selection and performed effectively
(Anderson et al. 1994), I used it as an additional tool to distinguish between
models. The philosophy behind this approach, as opposed to using an
ANOVA or Kruskal-Wallis to test for differences, is discussed in White and
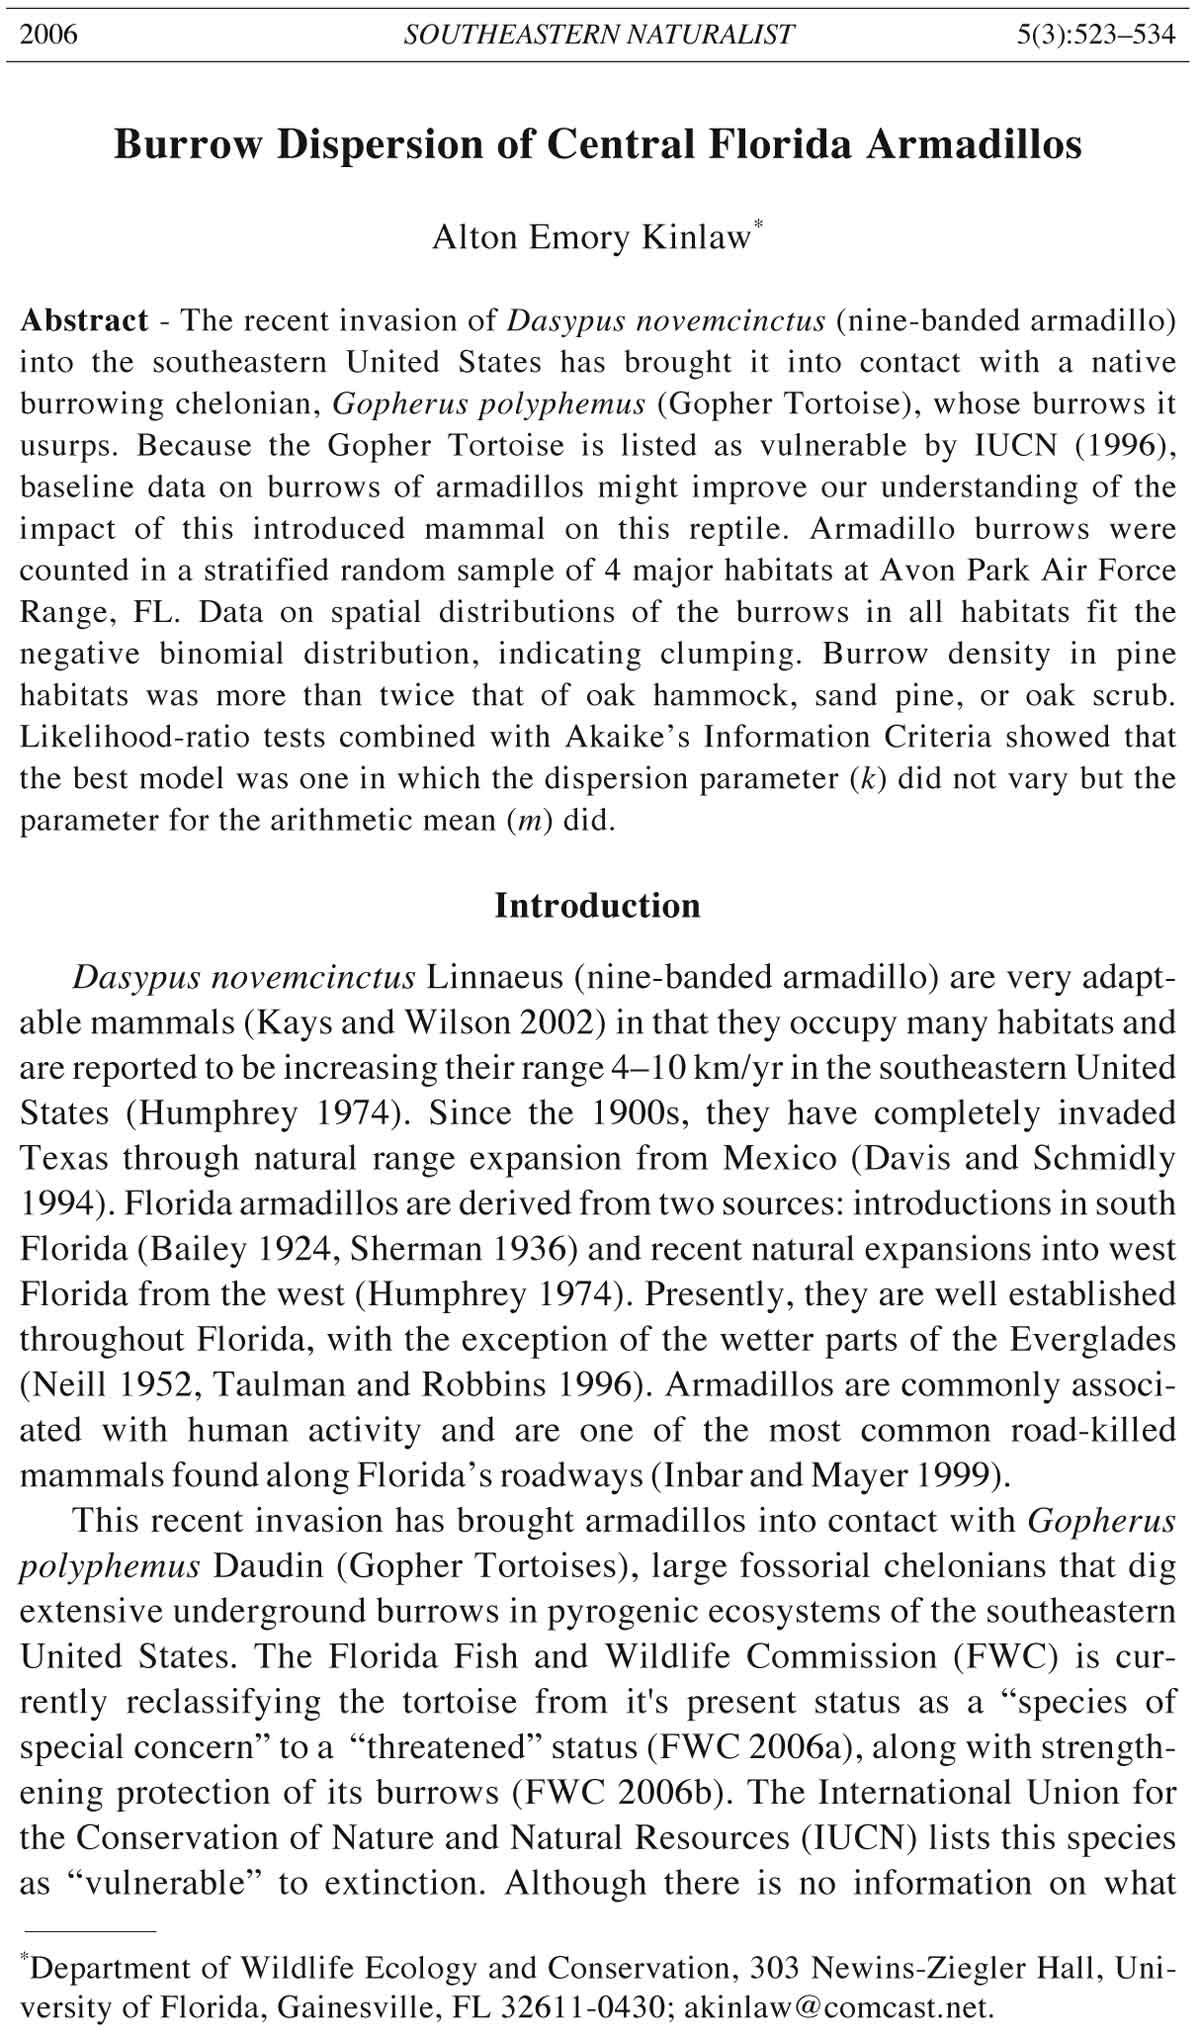
Figure 1. Upper graph: frequency count of armadillo burrows at Avon Park Air Force
Bombing Range, FL, in 1997–98, in 4 habitats. Lower graph: the actual pine data
compared to that expected by the negative binomial distribution. Pine data truncated
above 4 burrows/quadrat in upper graph.
528 Southeastern Naturalist Vol. 5, No. 3
Bennetts (1996), and my methodology for model comparison is a straightforward
application of their approach. Software used for data analysis
include Resampling Stats (Arlington, VA), StatXact 3 (version 3.02), and
the Quadrat Sampling program, developed by Krebs (1999; Exeter Software,
Setauket, NY). For the log-likelihood tests that follow White and Bennetts
(1996), Krebs (1999) modified the PALANL Fortran program originally
written by Gary White, Colorado State University.
Results
Burrow counts showed that all 4 habitats were utilized by armadillos. A
habitat effect on burrow counts was found (Pearson’s chi-square statistic =
16.06, exact p-value = 0.0009; StatXact 3.02). The mean number of burrows/
quadrat in pine was more than twice the density of the other habitats;
however, the lower 95% (resampled) confidence interval for pine overlapped
the upper 95% confidence interval for oak hammock (Table 1).
Confidence intervals for oak scrub, sand pine, and oak hammock overlapped
considerably. Pine habitat also had the highest proportion of plots with
burrows (Table 1). The odds of finding armadillo burrows on random quadrats
in pine was 4.64, 2.95, and 4.19 times that of finding burrows in oak
scrub, sand pine, or oak hammock, respectively. The stratified randomsample
estimate of burrows in the largest habitat (pine) ranged from 31,467
to 63,920 burrows.
The variance/mean ratio was much greater than unity for all habitats,
indicating a clumped distribution. The standardized Morisita Index (Smith-
Gill 1975) values for oak scrub, pine, and sand pine were all around 0.5,
indicating the armadillo burrows were clumped. Clumping in oak hammock
was somewhat greater, with a Morisita Index value of 0.8125. A random
spatial distribution was rejected for oak scrub, sand pine, and the oak
Table 1. Summary statistics for armadillo burrow quadrat study in 4 upland habitats at Avon
Park Air Force Range, l997–98. All values listed are actual field data except confidence
intervals (C.I.R) which represent the 0.025 and 0.975 percentiles of 1000 bootstrapped samples
of the dataset. Ha of habitat = number of hectares of listed habitat type; Estimated # of burrows
= estimate of number of burrows in listed habitat; Proportion with burrows = proportion of plots
with burrows in listed habitat; and SMI = standardized Morisita Index.
Oak scrub Pine Sand pine Oak hammock
Number of plots 55 53 23 17
Number of burrows 25 98 15 12
Mean # of burrows/quadrat 0.45 1.85 0.65 0.71
Variance 1.10 6.05 1.60 2.60
C.I.R 0.2182, 0.7488 1.245, 2.529 0.2174, 1.175 0.176, 1.588
Ha of habitat 1762 25275 518 879
Estimated # of burrows 384–1319 31,467–63,920 113–609 155–1396
Proportion with burrows 0.218 0.566 0.304 0.255
C.I.R 0.109, 0.327 0.434, 0.698 0.130, 0.478 0.059, 0.471
SMI 0.5216 0.5072 0.5294 0.8125
2006 A.E. Kinlaw 529
hammock (p-value < 0.01 in all 3 cases). The U statistic for the oak scrub
and sand pine data were each less than 2 respective standard errors, as was
the T statistic for the oak hammock dataset, indicating that the negative
binomial was a plausible model. However, for small datasets, the T and U
statistic are approximate tests only (Krebs 1999). The chi-squared test on the
larger pine dataset did not reject the null hypothesis that the NBD fit the data
(chi-squared statistic = 1.773, 5 d.f., p-value = 0.91).
The frequency count data for the model-comparison tests are illustrated
in Figure 1. The results of the likelihood-ratios tests suggest that model {k,
mv} (i.e., k is constant but m differs) is better suited than the other models
(Table 2). Although model {kv,m} was marginally rejected over {k,m},
indicating some effect from k, model {k, mv} was not rejected over the full
model ({kv , mv}) suggesting little effect from k. More importantly, the
rejection of reduced model {k, m} over {k, mv} was highly significant (p =
0.002), indicating that m differs (Table 2). My selection of model {k, mv} as
the correct model is supported by both the GOF tests and the fact that this
model had the lowest AIC scores (Table 3).
Discussion
The chi-squared test showed a strong association between habitat and
the frequency of armadillo burrows at Avon Park, indicating that armadillos
do have habitat preferences for burrow digging. The mean number of
burrows/quadrat and the proportion of quadrats with burrows both indicated
that pine was the preferred habitat for digging burrows in this
study. The odds of locating burrows in pine were higher than the other
upland habitats listed. The wide overlap in confidence intervals between
Table 2. Likelihood-ratios tests (LRTs) comparing the initial 4 models of armadillo burrow
dispersion to determine if differences exist in m (mean), k (clumping parameter), or both.
General model Reduced model LRT df P
{k, mv} {k, m} 15.034 3 0.002
{kv, m} {k, m} 7.508 3 0.057
{kv, mv} {k, m} 19.504 6 0.003
{kv, mv} {k, mv} 4.470 3 0.215
{kv, mv} {kv, m} 11.996 3 0.007
Table 3. Log-likelihood, G statistic for goodness of fit, degrees of freedom of G (probability >
G is denoted by P), and Akaike Information Criteria (AIC) scores for each of the four initial
models used in armadillo burrow study.
Model Log likelihood G df P AIC
{k, m} -191.415 43.55 21 0.003 388.830
{k, mv} -184.898 28.51 18 0.075 79.796
{kv, m} -188.661 36.04 18 0.009 387.323
{kv,mv} -182.663 24.04 15 0.086 381.328
530 Southeastern Naturalist Vol. 5, No. 3
oak scrub, sand pine, and oak hammock indicates that these habitats may
not vary in the numbers of burrows dug.
Taber (1945) claimed that forested habitats such as pine may be preferred
by armadillos because they probe for food more frequently around decaying
logs prevalent in these habitats. This may not hold true for central Florida (J.
Layne, James Layne, Archibold Biological Station, Lake Placid, FL, pers.
comm.). Unfortunately, we could not evaluate this because our survey did
not include detailed examinations of armadillo probings in the field.
The density of 1.7 burrows/hectare reported here is considerably less
than the 42.5 reported for upland pine in northern Florida by McDonough et
al. (2000). There are probably several reasons for this disparity. A likely
contributing factor is the very wet conditions that occurred during our
survey. During our survey period, the lower Kissimmee River area (along
the eastern boundary of APR) had mean rainfall of 140 cm., about 15 cm.
higher than the 1972–1996 mean (Geoff Shaughnessy, South Florida Water
Management District, West Palm Beach, FL, pers. comm.). In Florida,
armadillos will shift to higher and drier terrain during periods of excess
rainfall (Gause 1980); the wet conditions may have simply driven many
armadillos to leave the area, resulting in a lower density on most plots and
thus fewer burrows dug. An additional contributing factor may have been a
decreased detection probability. Many of the pine plots occurred at lower
elevations, where water would often stand after heavy rains. It is very
possible that many of the armadillo burrow openings may have been rapidly
filled in with debris or sand carried in by the water, hampering our visibility.
The resource base may have been adversely affected: flooding on some plots
could have decreased the insect prey base, especially larvae stages, causing
armadillos to move elsewhere in search of food. In the northern Florida
study, burrows were sampled during the hot summer months, when armadillos
were more active and probably dug more burrows; many of our pine plots
were sampled in the winter. Finally, we did not attempt to count juvenile
burrows, whereas McDonough et al. (2000) did count them.
It was not surprising that my graphs closely approximated a negative
binomial model. Although the standardized Morisita index showed that
burrow dispersion was not random, but clumped, the LRT tests showed
that this clumping did not differ between habitats. Thus, armadillos dig
their burrows in about the same pattern in these habitats, but just dig
considerably more burrows in the pine, a conclusion that agrees with
earlier studies (Clark 1951, Fitch et al. 1952) demonstrating a preference
for mesic habitats.
Because armadillos dig multiple burrows within their home range, the
method of using burrow counts as a population index is problematic
(McDonough and Loughry 2001) for several reasons. Armadillos have
been reported to dig different numbers of burrows in different types of soil
conditions (Taber 1945). The home range of males overlaps that of females
2006 A.E. Kinlaw 531
(Layne and Glover 1977, Zimmerman 1982); thus, in some parts of the
home range, the burrow density may reflect more than one individual.
Armadillos apparently dig different types of burrows, including shorter
burrows used as a food probes or food traps (Taber 1945), escape burrows
(Breece and Dusi 1985, Galbreath 1980), as well as typical nesting burrows
(Clark 1951). The existence of these auxiliary burrows might confound any
relationship between nesting-burrow count and population density. Armadillos
will construct above ground nests in both the Northern (Layne and
Waggener 1984) and Southern (Platt and Rainwater 2003) Hemispheres, so
a count of ground burrows could not be relied on to provide an accurate
index. Finally, armadillos transport grass, leaves and twigs into burrows
that are to be used for nesting purposes, an activity that precludes the use
of video probes for identifying active (e.g., occupied) burrows. Thus, the
development and calibration of a “burrows-to-individual correction factor”
for this mammal is not feasible at this time.
Although biological mechanisms cannot be inferred by fitting statistical
distributions to quadrat counts, patterns seen in the data can be described
(Krebs 1999). Because the relationship between burrows to individuals is
not known, I cannot make any inferences about the population size of
armadillos at APR. However, the data on burrow counts in the 4 habitats
were unbiased and provide reliable evidence for dispersion to be the same
while mean values vary between the habitats (model {k,mv}) .
Acknowledgments
I acknowledge the Natural Resources Flight of the Avon Park Air Force Bombing
Range for financial support. Pat Walsh assisted with many operational aspects
of the field work, and Peg Margosian provided valuable GIS support. I thank the
Florida Cooperative Wildlife Research Unit for their assistance in managing the
funds used for this research. Dick Franz, Florida Museum of Natural History,
served as the Avon Park project director. Rex Kinlaw, Richard Owens, Chris
O’Brien, Lora Smith, and several volunteers assisted with field surveys. James
Layne reviewed an early draft of the manuscript. Charles Krebs answered questions
about his computer program. Colleen McDonough clarified plot data from her
northern Florida study. A special debt of gratitude is owed Gary White, Colorado
State University, who provided the SURVIV code he used in the White and
Bennetts (1996) paper and corrected my SURVIV code. Marinela Capanu, Graduate
Consultant, Department of Statistics, IFAS, University of Florida, wrote a
program in the R computing system (R Development Core Team 2004) to compute
p-values for the G statistic.
Literature Cited
Anderson, D.R., K.P. Burnham, and G.C. White. 1994. AIC model selection in
overdispersed capture-recapture data. Ecology 75:1780–1793.
Bailey, H.H. 1924. The armadillo in Florida and how it reached there. Journal of
Mammalogy 5:264–265.
532 Southeastern Naturalist Vol. 5, No. 3
Bliss, C.I., and R.A. Fisher. 1953. Fitting the negative binomial distribution to
biological data and a note on the efficient fitting of the negative binomial.
Biometrics 9:176–196.
Breece, G.A., and J.L. Dusi. 1985. Food habits and home ranges of the common
long-nosed armadillo Dayspus novemcinctus in Alabama. Pp. 419–427, In G.G.
Montgomery (Ed.). The Evolution and Ecology of Armadillos, Sloths, and
Vermilinguas. Smithsonian Institution Press, Washington, DC. 451 pp.
Caughley, G. 1977. Analysis of Vertebrate Populations. John Wiley and Sons. New
York, NY. 234 pp.
Clark, W.K. 1951. Ecological life history of the armadillo in the eastern plateau
region. American Midland Naturalist 46:337–358.
Cochran, W.G. 1963. Sampling Techniques, Second Edition. John Wiley and Sons,
Inc., New York, NY. 405 pp.
Davis, W.B., and D.J. Schmidly. 1994. The Mammals of Texas. Texas Parks and
Wildlife, Austin, TX. 338 pp.
Efron, B., and R. Tibshirani. 1986. Bootstrap measures for standard errors, confidence
intervals, and other measures of statistical accuracy. Statistical Science
1:54–77.
Elliott, J.M. 1971. Some Methods for the Statistical Analysis of Samples of Benthic
Invertebrates. Scientific Publication No. 25. First Edition. Freshwater Biological
Association, The Ferry House, Ambleside, UK.
Fitch, H.S., P. Goodrum, and C. Newman. 1952. The armadillo in the Southeastern
United States. Journal of Mammalogy 33(1):21–37.
Galbreath, G.J. 1980. Aspects of natural selection in Dasypus novemcinctus. Ph.D.
Dissertation. University of Chicago, Chicago, IL. 102 pp.
Galbreath, G.J. 1982. Armadillo, Dasypus novemcinctus. Pp. 71–79, In J.A.
Chapman and G.A. Feldhamer (Eds.). Wild Mammals of North America. The
Johns Hopkins University Press, Baltimore, MD. 1147 pp.
Gause, G.E. 1980. Physiological and morphometric responses of the nine-banded
armadillo (Dasypus novemcinctus) to environmental factors. Ph.D. Dissertation.
University of Florida, Gainesville, FL. 112 pp.
Guyer, C., and S.M. Hermann. 1997. Patterns of size and longevity of Gopher
Tortoise (Gopherus polyphemus) burrows: Implications for the longleaf pine
ecosystem. Chelonian Conservation and Biology 2(4):507–513.
Humphrey, R.R. 1974. Zoogeography of the nine-banded armadillo in the United
States. Bioscience 24:457–462.
Inbar, M., and R.T. Mayer. 1999. Spatio-temporal trends in armadillo diurnal activity
and road-kills in central Florida. Wildlife Society Bulletin. 27(3):865–872.
IUCN. 1996. 1996 IUCN red list of threatened animals. IUCN, Gland, Switzerland.
Kays, R.W., and D.E. Wilson. 2002. Mammals of North America. Princeton University
Press, Princeton, NJ. 240 pp.
Krebs, C.J. 1999. Ecological Methodology. Second Edition. Addison Wesley
Longman Inc., Menlo Park, CA. 620 pp.
Layne, J.N., and D. Glover. 1977. Home range of the armadillo in Florida. Journal of
Mammalogy 58(3):411–413.
Layne, J.N., and A.M. Waggener, Jr. 1984. Above-ground nests of the nine-banded
armadillo in Florida. Florida Field Naturalist 12:58–61.
2006 A.E. Kinlaw 533
Malhado, A.C.M., and M. Petrere, Jr. 2004. Behaviour of dispersion indices in
pattern detection of a population of angico, Anadenanthera peregrine
(Leguminosae). Brazilian Journal of Biology 64(2):243–249.
McDonough, C.M., and W.J.Loughry. 2001. Armadillos. Pp. 796–799, In D.
MacDonald, and S. Norris (Eds.). The Encyclopedia of Mammals. Vol. III.
Marsupials, Insect Eaters, and Small Herbivores. Facts on File, Inc., New York,
NY. 930 pp.
McDonough, C.M., M.A. DeLaney, P.Q. Le, M.S. Blackmore, and W.J. Loughry.
2000. Burrow characteristics and habitat associations of armadillos in Brazil and
the United States of America. Revista de Biologia Tropical 48(1):109–120.
McNab, B.K. 1980. Energetics and the limits to a temperature distribution in armadillo.
Journal of Mammalogy 61:606–627.
Neill, W.T. 1952. The spread of the armadillo in Florida. Ecology 33(2):283–284.
Overton, W.S. 1971. Estimating the numbers of animals in wildlife populations. Pp.
403–456, In R.H. Giles (Ed). Wildlife Management Techniques. Third Edition.
The Wildlife Society, Washington, DC. 633 pp.
Pielou, E.C. 1969. Introduction to Mathematical Ecology. Wiley-Interscience, New
York, NY. 286 pp.
Platt, S.G., and T.R. Rainwater. 2003. Above-ground “nest” of the nine-banded
armadillo in Belize. Florida Field Naturalist 31:8–0.
R Development Core Team. 2004. R: A language and environment for statistical
computing. R Foundation for statistical computing, Vienna, Austria. Available
online at http:://www.R-project.org. Accessed October 8, 2004.
Sherman, H.B. 1936. A list of the recent land mammals of Florida. Proceedings of
the Florida Academy of Science 1:102–128.
Smith-Gill, S.J. 1975. Cytophysiological basis of disruptive pigmentary patterns in
the Leopard Frog Rana pipiens. II. Wild type and mutant cell specific patterns.
Journal of Morphology 146:35–54.
Sokal, R.R., and R.J. Rohlf. 1981. Biometry. Second Edition. Freeman. San Francisco,
CA. 859 pp.
Steel, R.G.D., and J.H. Torrie. 1980. Principles and Procedures of Statistics: A
Biometrical Approach. Second Edition. McGraw-Hill Book Company, New
York, NY. 633 pp.
Sutherland, W.J. 1996. Ecological Census Techniques: A Handbook. Cambridge
University Press, Cambridge, UK. 336 pp.
Taber, F.W. 1945. Contribution on the life history and ecology of the nine-banded
armadillo. Journal of Mammalogy 26:211–226.
Taulman, J.F., and L.W. Robbins. 1996. Recent range expansion and distributional
limits of the nine-banded armadillo (Dayspus novemcinctus) in the United States.
Journal of Biogeography 23:634–648.
White, W.A. 1970. The geomorphology of the Florida peninsula. Florida Department
of Natural Resources. Geological Bulletin Number 51, Tallahassee, FL.
White, G.C., and R.E. Bennetts. 1996. Analysis of frequency count data using the
negative binomial distribution. Ecology 77(8):2549–2557.
White, G.C., and L.E. Eberhardt. 1980. Statistical analysis of deer and elk pelletgroup
data. Journal of Wildlife Management 44:121–131.
534 Southeastern Naturalist Vol. 5, No. 3
Wirtz, W.O., D.H. Austin, and G.W. Dekle. 1985. Food habits of the common longnosed
armadillo Dayspus novemcinctus in Florida, 1960–61. Pp. 439–451, In
G.G. Montgomery (Ed.). The Evolution and Ecology of Armadillos, Sloths, and
Vermilinguas. Smithsonian Institution Press, Washington, DC. 451 pp.
Wood, D.A. l996. Florida’s endangered species, threatened species, and species of
special concern. Official Lists. Florida Game and Fresh Water Fish Commission,
Tallahassee, FL. 14 pp.
Zimmerman, J.W. 1982. The common long-nosed armadillo (Dasypus
novemcinctus) in north-central Oklahoma. M.Sc. Thesis. Oklahoma State University,
Stillwater, OK. 106 pp.


 The Southeastern Naturalist is a peer-reviewed journal that covers all aspects of natural history within the southeastern United States. We welcome research articles, summary review papers, and observational notes.