2006 SOUTHEASTERN NATURALIST 5(3):453–462
Intra-annual Loggerhead and Green Turtle
Spatial Nesting Patterns
John F. Weishampel1,*, Dean A. Bagley1, and Llewellyn M. Ehrhart1
Abstract - We analyzed a 15-year (1989–2003) dataset of spatial nesting locations
for Loggerhead and Green Turtles along a 40.5-km stretch of beach encompassing
the Archie Carr National Wildlife Refuge along the Atlantic coast of Florida. To
assess whether there are differences in spatial distribution influenced by temporal
site-selection cues, we divided each season into quartiles and analyzed the
autocorrelative patterns of the nest distributions within each time frame. Fundamentally,
intraspecific differences in nest spatial patterns from the beginning to the end
of the nesting season were minor. Though the temporal grain of the analyses may not
be able to discern affects of fine-scale fluctuations (e.g., high- and low-tide events),
these results suggest that environmental variables that change over the nesting season
(e.g., ocean temperatures, daylength, and existing human activities) are not significantly
influencing where these sea turtles place their nests.
Introduction
After oviposition, female sea turtles abandon their nests. Hence, in the
absence of parental care, the location of the nest is a critical determinant of
egg survivorship. Not surprisingly, nest-site selection is non-random and
somewhat predictable (Tiwari et al. 2005, Weishampel et al. 2003). The
drivers of this behavior, the extent to which they are genetically hardwired
or influenced by the environment, are unknown. Sea turtles are renowned
for natal homing that enables them with a high degree of accuracy to return
to the general region of their birth (Bowen 1995, Carr and Carr 1972,
Miller 1997). Displacement studies have shown that juvenile Caretta
caretta Linnaeus (Loggerheads) (Avens et al. 2003) and Chelonia mydas
Linnaeus (Green Turtles) (Lohmann et al. 2004) reorient themselves towards
their capture site. This compassing ability has been attributed, in
part, to geomagnetic and visual cues (Avens and Lohmann 2003).
Additional environmental factors that may affect fine-scale migratory behaviors,
such as those which relate to nest-site selection, include marine
(such as coastal landmarks, currents, chemical gradients, and low-frequency
sound; e.g., Carr 1972; Hughes 1974; Lohmann and Lohmann
1993, 1996; Marcovaldi and Laurent 1996; Mortimer 1995) and terrestrial
(such as beach slope, presence of vegetation, sand texture, and artificial
lighting; e.g., Kamel and Mrosovsky 2004, 2005; Kikukawa et al. 1996;
Provancha and Ehrhart 1987; Salmon et al. 1995; Whitmore and Dutton
1985; Witherington 1992) properties.
1Department of Biology, University of Central Florida, Orlando, FL 32816-2368.
*Corresponding author - jweisham@mail.ucf.edu.
454 Southeastern Naturalist Vol. 5, No. 3
The coastline of east-central Florida is home to the highest concentration
of nesting, threatened Loggerhead Turtles in the western hemisphere
(Ehrhart and Raymond 1983), representing ≈ 25% of all Loggerhead Turtle
nests worldwide (US Fish and Wildlife Service 2006). These beaches also
have the highest concentration of nesting, endangered Green Turtles in the
continental United States (Ehrhart and Raymond 1987), representing
≈ 35% of US Green Turtle nests (US Fish and Wildlife Service 2006). Our
previous study on this beach (Weishampel et al. 2003) documented the
high level of spatial consistency in inter-annual nesting behaviors of Loggerhead
and Green Turtles. However, the fact that Loggerhead nesting has
been occurring earlier in the nesting season by about 10 days over the last
15 years (Pike et al.2006, Weishampel et al. 2004) suggests that some
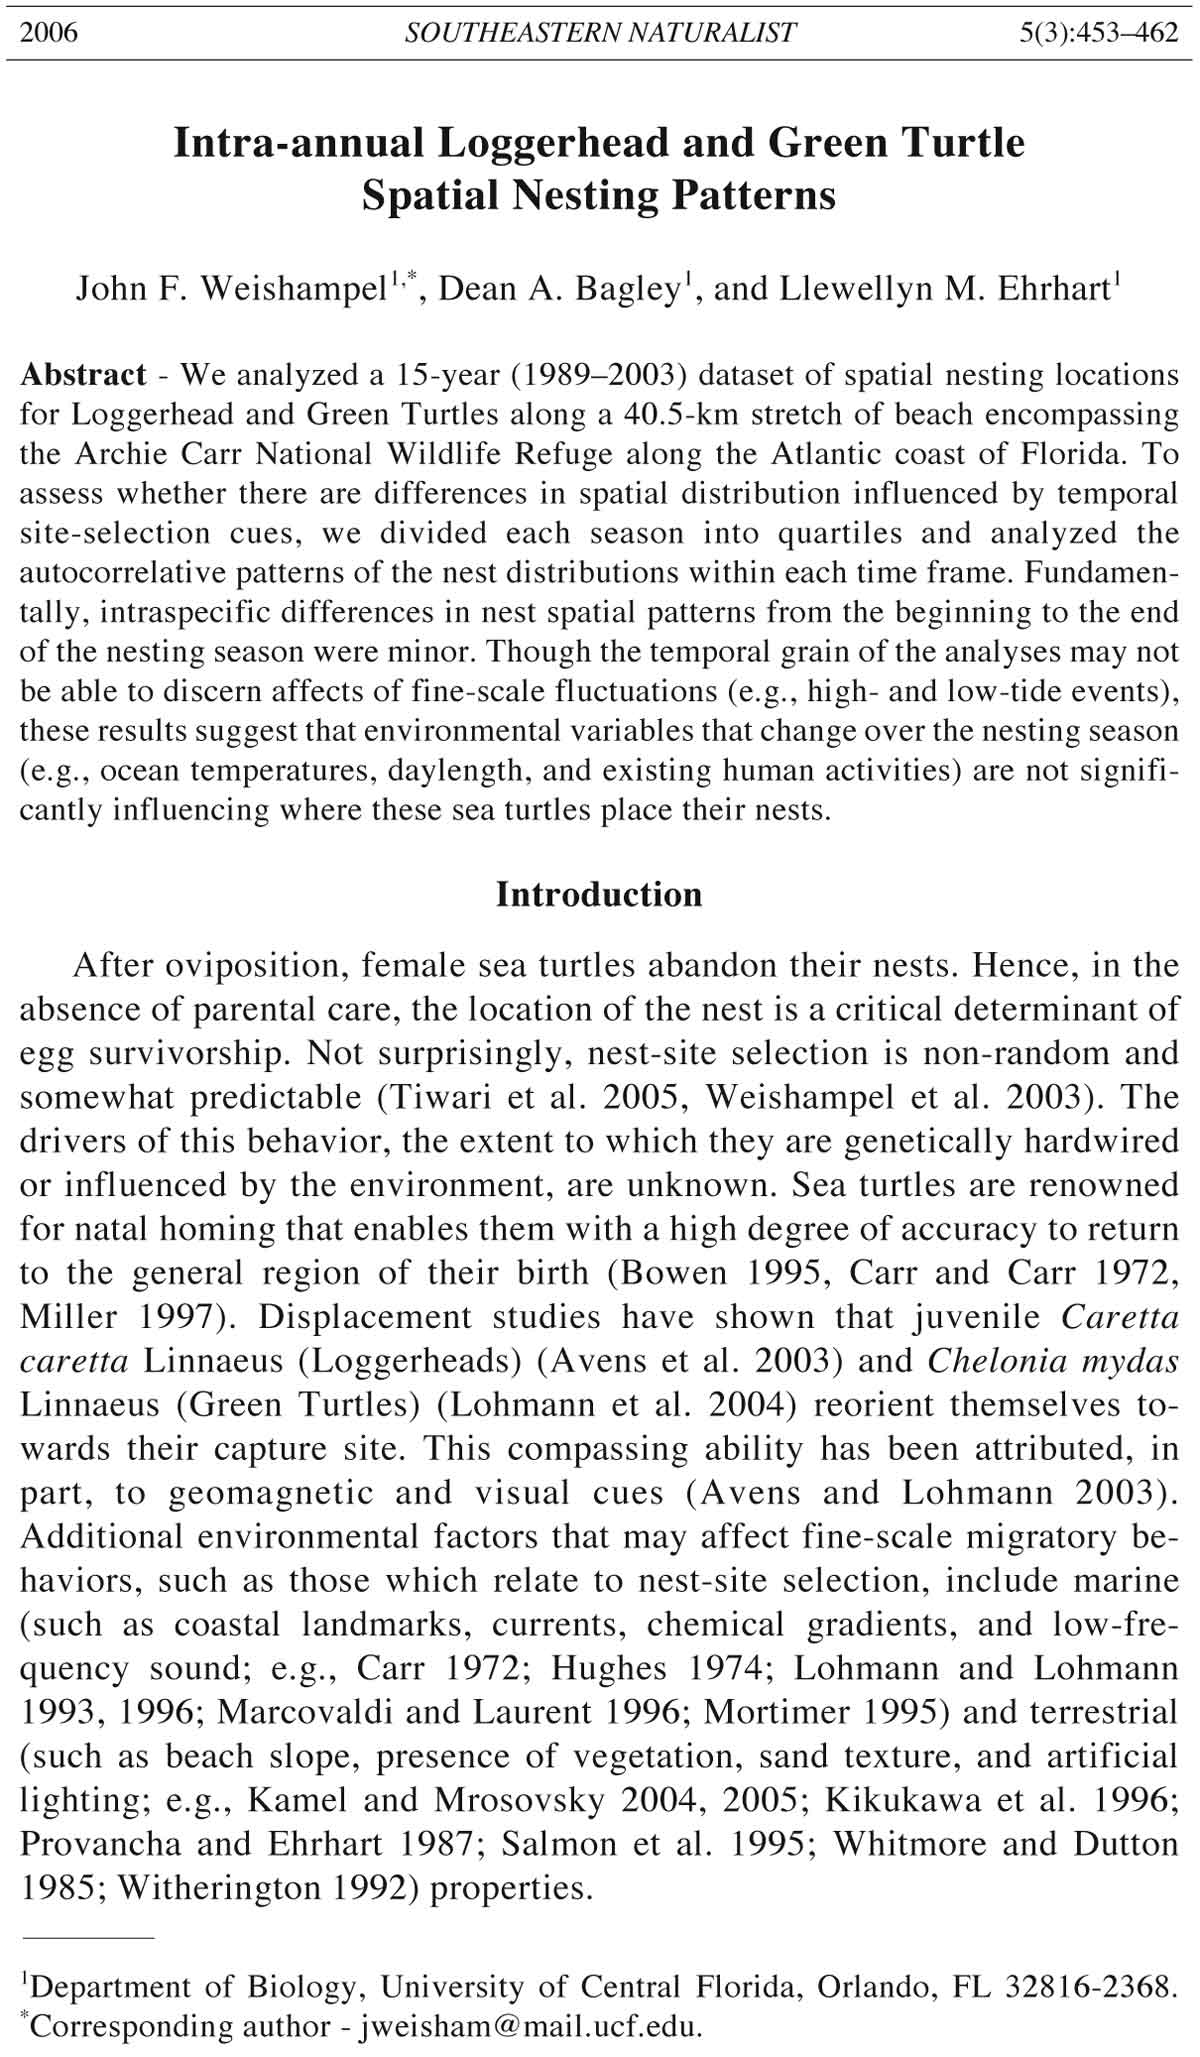
behaviors may be more plastic. Here, we assess their intra-annual spatial
patterns. These analyses relate to the question of whether or not environmental
parameters that change within nesting seasons—such as lunar
cycles, day length, storm events, human activities, etc.—alter the spatial
patterns of nest-site selection (Fig. 1); however, they do not explicitly test
for such environmental influences.
Figure 1. Examples of environmental parameters which vary over a nesting season
that could potentially influence spatial nesting patterns. These were scaled to represent
the maximum and minimum values for the measurement period. Ocean temperatures
were long-term averages off the Melbourne, FL coast. The lunar and solar
properties were calculated for 2002. The grey panels reflect the extent of the Loggerhead
nesting quartiles for 2002.
2006 J.F. Weishampel, D.A. Bagley, and L.M. Ehrhart 455
Methods
Nesting data collection
The study area is a stretch of beach along a barrier island on the east
coast of Florida south of Cape Canaveral. This 40.5-km of coastline was
divided into eighty-one 0.5-km sections. The southern 21 km includes the
Archie Carr National Wildlife Refuge extending from Sebastian Inlet to
Melbourne Beach. Human density and commercial development increases
towards the northern boundary, which extends to the Patrick Air Force
Base. Following the Index Nesting Beach Survey (INBS) protocols from
the Florida Fish and Wildlife Conservation Commission (Witherington and
Koeppel 2000), all sea turtle nesting events within each 0.5-km section
were counted daily in dawn surveys from 1989–2003. Species were identified
from track characteristics. These surveys typically extend from the
beginning of May until the end of August. Because of discrepancies in the
initiation and duration of the surveys, we examined a window (10 May–30
August) that represented a consistent sampling effort and the majority
(98.1% for Loggerheads, 95.8% for Green Turtles) of recorded annual
nesting events (Weishampel et al. 2004).
Spatio-temporal data analyses
Within the 113-day window, the nesting season for each species was
arbitrarily divided into quartiles based on nest numbers. This breaks the
nesting season into smaller time frames, where presumably there are different
environmental factors, and eliminates the influence of nest number.
Though other quantile divisions could have been used, it was thought that
quartiles would provide a sufficient number of nests distributed across the
81 beach sections for comparison. This is especially important for
the analysis of Green Turtle nests, which tend to have very low densities in
the northern end of the study area. To determine whether or not spatial
nesting patterns differed among quartiles, Pearson correlation coefficients
were calculated for the average number of nests in a given 0.5-section. To
further assess spatial patterns over the nesting season and to test for statistical
differences, we calculated autocorrelation values across a range of lag
distances using semivariance (Dale et al. 2002) for each quartile for each
year. Semivariograms, which are plots of semivariance (γ) against lag distances
(d), where x is the number of nests at location i and n is the total
number of sample pairs for a given lag, were produced to visualize spatial
patterns using the equation:
Σ + = −
i
i i d
x x
n
d 2 ( )
2
1
γ ( )
The resulting semivariogram plots are characterized by three values termed
sill, range, and nugget. The sill is the value where the semivariance levels
off, depicting the amount of variance. The range is the distance at which
the levelling occurs, depicting the scale of autocorrelation. The nugget is the
456 Southeastern Naturalist Vol. 5, No. 3
semivariance at a lag distance of 0, depicting the variance below the sampling
resolution, i.e., 0.5 km. For each quartile, the resulting semivariograms
were fitted to standard models to estimate the three descriptors using GS+
software (Gamma Design 2005). The values for each quartile for the two
species over the 15-year period were compared using an ANOVA approach.
Though the coastline from end to end of the study area is not perfectly
straight, we treated the 40.5-km area and the 0.5-km sections as though they
comprised a linear transect.
Results
The nest tallies from the annual surveys within the 10 May–August 30
window are shown in Figure 2. Green Turtle nesting is characterized by
annual high-low fluctuations in nest number (Hughes 1995, Weishampel et
al. 2003). The difference in the timing of nesting is depicted in Figure 3.
Figure 2. Loggerhead (black)
and Green Turtle (grey) nest
counts from the study area
within the 10-May to 30-August
window.
Figure 3. Average
daily
numbers of
Loggerhead
(black) and
Green Turtle
(grey) nests
between 10-
May and 30-
August from
1989 to 2003.
E x t e n s i o n
bars are measures
of standard
error.
2006 J.F. Weishampel, D.A. Bagley, and L.M. Ehrhart 457
Loggerhead nesting along this beach peaks in mid- to late June whereas
Green Turtle nesting peaks in mid- to late July. There is substantially more
variation around the daily nest numbers in Green Turtles, which reflects the
biennial pattern of nest numbers. The shape of the nesting distributions
within this window is further quantified by the average number of days
representing each quartile over this 15-year period (Fig. 4). The daily nesting
patterns of Loggerheads has a rapid rise and slow decline towards the
end of the season where the Green Turtle has a slow rise and a rapid decline.
However, Loggerhead and Green Turtles have been found to nest sporadically
before May 10 and after August 30, respectively, which may yield
more of a beginning and ending tail for each species. Though the timing of
nesting is different, the two species generally show similar spatial patterns
of annual nest distribution (Weishampel et al. 2003); there are significantly
more nests in the southern half of the study area than the more humanimpacted
northern half (Fig. 5). Furthermore, these intraspecific patterns are
Figure 4. Average number of days
included in each quartile (Q) from
1989 to 2003 for Loggerhead (black)
and Green Turtle (grey) nests. Extension
bars are measures of standard
deviation.
Figure 5. Spatial distribution of average
nest number for (A) Loggerhead
and (B) Green Turtles along
the 40.5-km coastline from north to
south for seasonal quartiles from
1989 to 2003.
458 Southeastern Naturalist Vol. 5, No. 3
significantly correlated (P < 0.01) from quartile to quartile (Table 1). This is
mirrored by the similar intraspecific semivariograms for each quartile
(Fig. 6). The general autocorrelation patterns for both species are representative
of those found with a gradient response. However, Loggerhead
semivariograms were best modeled using a spherical model (average R2 =
0.98), whereas Green Turtle semivariograms were best modeled using an
exponential model (average R2 = 0.63). Given the discrepancy in number of
nests for the two species, it is not surprising that the sill and nugget values
differ (Table 2). The ranges, which represent the scale of autocorrelation,
also differ with Loggerheads having smaller ranges by about 20 m. When
comparing within species, only the nugget values differed significantly for
Loggerheads for first and fourth quartiles; otherwise, the spatial patterns
were not significantly different. The higher nugget value suggests that there
is more spatial structure below the sampling scale in the first quartile than
the fourth quartile.
Figure 6. Average semivariograms
for (A) Loggerhead and (B) Green
Turtle nests for each intra-seasonal
quartile across the 1989–2003 period.
Extensions are measures of
standard error.
Table 1. Pearson correlation coefficients for nest number from 1989 to 2003 averaged for each
0.5-km beach segment for a given nesting-season quartile (Q). The lower left and upper right
correlations correspond to Loggerhead and Green Turtle nest numbers along the 40.5-km beach,
respectively. All correlations are significant at the P < 0.01 level.
Q-1 Q-2 Q-3 Q-4
Q-1 1.00 0.91 0.91 0.90
Q-2 0.99 1.00 0.95 0.94
Q-3 0.98 0.99 1.00 0.95
Q-4 0.96 0.98 0.98 1.00
2006 J.F. Weishampel, D.A. Bagley, and L.M. Ehrhart 459
Discussion
Though there were significant annual fluctuations in the numbers of
Loggerhead and Green Turtle nests, there were little discernible intraspecific
spatial differences in the within-season nesting patterns on this important
stretch of beach, as was also found by Tiwari et al. (2005) with Green
Turtles in Tortuguero, Costa Rica. Thus, it is probable that early season
nesters follow similar cues as mid- and late season nesters. This suggests
there is no temporal trend to reduce competition for nests sites. However,
this lack of difference could reflect the relatively coarse temporal scale of
analysis, i.e., quartiles ranged from ≈ 20 to ≈ 60 days. Perhaps a finer
division of the nesting season may yield spatial differences associated with
finer scale environmental fluctuations. Additionally, the degree of spatial
similarity may reflect multiple nesting events by the same female within a
season, but over two or three quartiles. Multiple nesting events of Loggerheads
have been observed to be confined within 4.8 km on North Carolina
beaches (Webster and Cook 2001), well below the ≈ 30 km range found in
the semivariogram. Also, multiple nesting events of Green Turtles on these
central Florida beaches occur within 1.7 km on average (Johnson and
Ehrhart 1996). The fact that there is autocorrelation for both species may be
important when making comparative, statistical observations of nest differences
(e.g., survivorship, predation) along this beach.
Knowledge about the intra-annual spatial patterns of nesting could
have implications regarding egg-survival estimates associated with inundation
due to sea-level rise (Fish et al. 2005) or erosion due to storms
(Smith and Trembanis 2001). Because the spatial nesting patterns are
consistent throughout the season, mortality estimates after localized
flooding would be fairly straightforward. If the goal of beach management
is maintaining nest numbers, these findings suggest that strategies
(Garcia et al. 2003) that restrict beach use or reduce nest predation may
be able to focus on high nesting areas throughout the egg-laying season.
Table 2. Average semivariance descriptors for Loggerhead and Green Turtle species for each
quartile over the 15-year period. Standard errors are in parentheses. Intraspecific values with
different superscripts are significantly different (P < 0.05) based on a Tukey-Kramer post hoc
analysis.
Loggerhead Green Turtle
R2 Sill Range Nugget R2 Sill Range Nugget
Q-1 0.98 1983.3 30.8 47.3A 0.55 19.9 46.2 2.8
(0.0) (259.8) (2.0) (14.8) (0.1) (8.9) (14.8) (1.1)
Q-2 0.98 2010.3 30.4 36.4A,B 0.70 26.1 54.4 2.6
(0.0) (218.5) (1.8) (2.5) (0.1) (13.4) (13.9) (1.3)
Q-3 0.98 2355.3 33.9 17.4A,B 0.67 28.3 52.4 2.7
(0.0) (222.7) (2.3) (8.4) (0.1) (16.3) (12.5) (1.1)
Q-4 0.98 2392.8 31.8 4.8B 0.58 30.4 56.6 1.9
(0.0) (223.0) (1.6) (1.8) (0.1) (15.8) (14.7) (0.6)
460 Southeastern Naturalist Vol. 5, No. 3
However, if the management goal is more appropriately designed to promote
overall biodiversity, it is recommended that strategies cover a wider
region of the beach which potentially may maintain genetic variation
(Encalada et al. 1999) and demographic diversity (i.e., sex ratios) as a
result of different thermal regimes (Baptistotte et al. 1999).
Acknowledgments
This work was an extension of a classroom exercise of the spring 2003 Landscape
Ecology course at UCF. Particular thanks go to Karen Springmeyer for organizing
these data and to Michael Coyne and two anonymous reviewers for their suggestions.
The UCF Marine Turtle Research Group has been funded over the years by the US
Fish and Wildlife Service, World Wildlife Fund-US, NOAA National Marine Fisheries
Service, Indian River Audubon Society, US Army Corps of Engineers, and
Aquarina, Inc.
Literature Cited
Avens, L., and K.J. Lohmann. 2003. Use of multiple orientation cues by juvenile
Loggerhead Sea Turtles Caretta caretta. Journal of Experimental Biology
206:4317–4325.
Avens, L., J. Braun-McNeill, S. Epperly, and K.J. Lohmann. 2003. Site fidelity and
homing behavior in juvenile Loggerhead Sea Turtles (Caretta caretta). Marine
Biology 143:211–220.
Baptistotte, C., J.T. Scalfoni, and N. Mrosovsky. 1999. Male-producing thermal
ecology of a southern Loggerhead Turtle nesting beach in Brazil: Implications
for conservation. Animal Conservation 2:9–13.
Bowen, B.W. 1995. Molecular genetic studies of marine turtles. Pp. 585–587, In
K.A. Bjorndal (Ed.). Biology and Conservation of Sea Turtles. Smithsonian
Institution Press, Washington, DC. 615 pp.
Carr, A. 1972. The case for long-range chemoreceptive piloting in Chelonia. NASA
SP-262:469–483.
Carr, A., and Carr, M.H., 1972. Site fixity in the Caribbean Green Turtle. Ecology
53:425–429.
Dale, M.R.T., P. Dixon, M-J. Fortín, P. Legendre, D.E. Myers, and M.S. Rosenberg.
2002. Conceptual and mathematical relationships among methods for spatial
analysis. Ecography 25:558–577.
Ehrhart L.M., and Raymond, P.W. 1983. Loggerhead (Caretta caretta) and Green
Turtle (Chelonia mydas) nesting densities on a major east central Florida USA
nesting beach. American Zoologist 23:963.
Ehrhart L.M., and Raymond, P.W. 1987. Loggerhead (Caretta caretta) and Green
Turtle (Chelonia mydas) nesting densities in South Brevard County, Florida,
1981–84. Pp. 21–25, In W.N. Witzell (Ed.).Ecology of East Florida Sea Turtles:
Proceedings of the Cape Canaveral, Florida Sea Turtle Workshop Miami, Florida
February 26–27, 1985. NOAA Technical Report NMFS 53, Seattle, WA.
Encalada, S.E., J.C. Zurita, and B.W. Bowen. 1999. Genetic consequences of coastal
development: The sea turtle rookeries at X’cacel, Mexico. Marine Turtle Newsletter
83:8–10.
2006 J.F. Weishampel, D.A. Bagley, and L.M. Ehrhart 461
Fish, M.R., I.M. Cote, J.A. Gill, A.P. Jones, S. Renshoff, and A.R. Watkinson. 2005.
Predicting the impact of sea-level rise on Caribbean sea turtle nesting habitat.
Conservation Biology 19:482–491.
Gamma Design. 2005. GS+ Geostatistics for the environmental sciences. Version
7.0. Plainwell, MI.
Garcia, A., G. Ceballos, and R. Adaya. 2003. Intensive beach management as an
improved sea turtle conservation strategy in Mexico. Biological Conservation
111:253–261.
Hughes, G.R. 1974. The sea turtles of southeast Africa. 1. Status, morphology, and
distribution. Oceanographic Research Institute, Investigation Report 35. Durban,
Republic of South Africa.
Hughes, G.R. 1995. Nesting cycles in sea turtles—typical or atypical? Pp. 81–89, In
K.A. Bjorndal (Ed.). Biology and Conservation of Sea Turtles. Smithsonian
Institution Press, Washington, DC. 615 pp.
Johnson, S.A., and L.M. Ehrhart. 1996. Reproductive ecology of the Florida Green
Turtle: Clutch frequency. Journal of Herpetology 30:407–410.
Kamel, S.J., and N. Mrosovsky. 2004. Nest-site selection in Leatherbacks,
Dermochelys coriacea: Individual patterns and their consequences. Animal
Behaviour 68:357–366.
Kamel, S.J., and N. Mrosovsky. 2005. Repeatability of nesting preferences in the
Hawksbill Sea Turtle, Eretmochelys imbricate, and their fitness consequences.
Animal Behaviour 70:819–828.
Kikukawa, A., N. Kamezaki, K. Hirate, and H. Ota. 1996. Distribution of nesting
sites of sea turtles in Okinawajima and adjacent islands of the Central Ryukyus,
Japan. Chelonian Conservation and Biology 2:99–101.
Lohmann, K.J., and C.M.F. Lohmann. 1993. A light-independent magnetic compass
in the Leatherback Sea Turtle. Biological Bulletin 185:149–151.
Lohmann, K.J., and C.M.F. Lohmann. 1996. Orientation and open-sea navigation in
sea turtles. Journal of Experimental Biology 199:73–81.
Lohmann, K.J., C.M.F. Lohmann, L.M. Ehrhart, D.A. Bagley, and T. Swing. 2004.
Geomagnetic map used in sea-turtle navigation. Nature 428:909–910.
Marcovaldi, M.A., and A. Laurent 1996. A six-season study of marine turtle nesting
at Praia do Forte, Bahia, Brazil, with implications for conservation and management.
Chelonian Conservation and Biology 2:55–59.
Miller, J.D. 1997. Reproduction in sea turtles. Pp. 51–81, In P.L. Lutz and J.A.
Musick (Eds.). The Biology of Sea Turtles. CRC Press, Boca Raton, FL. 432 pp.
Mortimer, J.A. 1995. Factors influencing beach selection by nesting sea turtles. Pp.
45–51, In K.A. Bjorndal (Ed.). Biology and Conservation of Sea Turtles.
Smithsonian Institution Press, Washington, DC. 615 pp.
Pike, D.A., R.L. Antworth, and J.C. Stiner. 2006. Earlier nesting contributes to
shorter nesting seasons for the Loggerhead Seaturtle, Caretta caretta. Journal of
Herpetology 40:91–94.
Provancha, J.A., and L.M. Ehrhart. 1987. Sea turtle nesting trends at Kennedy Space
Center and Cape Canaveral Air Force Station, Florida, and relationships with
factors influencing nest-site selection. Pp. 33–44, In W.N. Witzell (Ed.). Ecology
of East Florida Sea Turtles: Proceedings of the Cape Canaveral, Florida Sea
Turtle Workshop Miami, Florida February 26–27, 1985. NOAA Technical Report
NMFS 53. Seattle, WA.
Salmon, M., R. Reiners, C. Lavin, and J. Wyneken. 1995. Behavior of Loggerhead
Sea Turtles on an urban beach. I. Correlates of nest placement. Journal of
Herpetology 29:560–567.
462 Southeastern Naturalist Vol. 5, No. 3
Smith, A.W.S., and A.C. Trembanis. 2001. Beach hardness variation: New moisturerelated
phenomenon and a case study from Byron Bay, Australia. Journal of
Coastal Research 17:869–876.
Tiwari, M., K.A. Bjorndal, A.B. Bolten, and B.M. Bolker. 2005. Intraspecific application
of the mid-domain effect model: Spatial and temporal nest distributions of
Green Turtles, Chelonia mydas, at Tortuguero, Costa Rica. Ecology Letters
8:918–924.
US Fish and Wildlife Service, 2006. Archie Carr National Wildlife Refuge. Available
at: http://www.fws.gov/archiecarr/. Accessed July 2006.
Webster, W.D., and K.A. Cook. 2001. Intraseasonal nesting activity of Loggerhead
Sea Turtles (Caretta caretta) in southeastern North Carolina. American Midland
Naturalist 145:66–73.
Weishampel, J.F., D.A. Bagley, L.M. Ehrhart, and B.L. Rodenbeck. 2003. Spatiotemporal
patterns of annual sea turtle nesting behaviors along an east-central
Florida beach. Biological Conservation 110:295–303.
Weishampel, J.F., D.A. Bagley, and L.M. Ehrhart. 2004. Earlier nesting by Loggerhead
Sea Turtles following sea-surface warming. Global Change Biology
10:1425–1428.
Whitmore, C.P., and P.H. Dutton. 1985. Infertility, embryonic mortality, and nestsite
selection in Leatherback and Green Sea Turtles in Suriname. Biological
Conservation 34:251–272.
Witherington, B.E. 1992. Behavioral responses of nesting sea turtles to artificial
lighting. Herpetologica 48:31–39.
Witherington, B.E., and C.M. Koeppel. 2000. Sea turtle nesting in Florida, USA,
during the decade 1989–1998: An analysis of trends. Pp. 94–96, In H. Kalb and
T. Wibbels (Compilers). Proceedings of the Nineteenth Annual Symposium on
Sea Turtle Conservation and Biology.South Padre Island, TX, March 2–6.
NOAA Technical Memo. NMFS-SEFSC-443. Miami, FL.


 The Southeastern Naturalist is a peer-reviewed journal that covers all aspects of natural history within the southeastern United States. We welcome research articles, summary review papers, and observational notes.