Effects of Landscape Characteristics on Water Quality and
Fish Assemblages in the Tallapoosa River Basin, Alabama
David T. Saalfeld, Eric M. Reutebuch, R. Jason Dickey, Wendy C. Seesock,
Cliff Webber, and David R. Bayne
Southeastern Naturalist, Volume 11, Issue 2 (2012): 239–252
Full-text pdf (Accessible only to subscribers.To subscribe click here.)
2012 SOUTHEASTERN NATURALIST 11(2):239–252
Effects of Landscape Characteristics on Water Quality and
Fish Assemblages in the Tallapoosa River Basin, Alabama
David T. Saalfeld1,*, Eric M. Reutebuch2, R. Jason Dickey3, Wendy C. Seesock2,
Cliff Webber4, and David R. Bayne4
Abstract - To maintain and improve water quality, there is an increasing need to understand
relationships between current land-use practices (e.g., agriculture, forested/silviculture,
and urban) and stream ecosystems. In this study, we investigated the relationships among
water quality, habitat composition, fish assemblages, and current land-use practices in
the Tallapoosa River Basin in eastern Alabama. Within the six streams investigated, all
fish metrics were significantly higher for forested watersheds compared to agricultural
watersheds, with total nitrogen and total phosphorus being the variables most descriptive
of fish biotic integrity (i.e., total nitrogen and total phosphorus were negatively related to
fish biotic integrity). In addition, we found that nutrient concentrations (especially total
nitrogen and total phosphorus) increased as percent agricultural land use increased. When
looking at a larger scale (Tallapoosa River Basin), anthropogenic impacts such as eutrophication
of Lakes Martin and Harris were related to agricultural land practices and the
percentage of the basin these practices occupy. Because current land-use practices appear
to be negatively impacting stream water quality and biota, it is important to decrease the
amount of fertilizer, pesticides, and animal waste that runoff into streams and to protect
riparian zones in order to preserve or improve biotic integrity.
Introduction
Changes in land use from watersheds dominated by forests to those dominated
by agriculture or urban areas can cause structural and functional shifts in aquatic
ecosystems (Allan 2004, Booth et al. 2004, Miltner et al. 2004, Paul and Meyer
2001, Roth et al. 1996, Wang et al. 2001). The resultant physical/chemical alterations
to streams can restructure biological assemblages, and cause declines in
diversity and productivity of invertebrates and fishes (Karr 1981, 1991; Maloney
et al. 2008; Richards et al. 1996; Scott 2006; Wang et al. 2001). Agricultural
runoff can deliver animal wastes, inorganic nutrients, pesticides, herbicides, and
sediments to streams (Wang et al. 2002). Some of the numerous potential negative
effects to stream biota caused by increases in agricultural land practices include
increased nutrient loading (Carpenter et al. 1998, Karr et al. 1985, Kronvang et
al. 1995, Rekolainen 1989, Shilling 2002), sedimentation (Lowrance et al. 1984,
Nerbonne and Vondracek 2001, Walser and Bart 1999), and a subsequent loss of
biotic diversity (Carpenter et al. 1998, Karr et al. 1986). Sediment and nutrient
loading is natural within aquatic systems; however, excessive inputs associated
1Arthur Temple College of Forestry and Agriculture, Stephen F. Austin State University,
Nacogdoches, TX 75965. 2Alabama Water Watch, Auburn, AL 36849. 3Cardno ENTRIX,
Inc., Tallahassee, fl32312. 4Department of Fisheries and Allied Aquaculture, Auburn
University, Auburn, AL 36849 *Corresponding author - dsaalfeld@gmail.com.
240 Southeastern Naturalist Vol. 11, No. 2
with poorly managed agricultural practices have been shown to have deleterious
effects on stream fishes and invertebrates (Nerbonne and Vondracek 2001, Rekolainen
1989).
Currently, one of the more discussed anthropogenic impacts of increased
agricultural land use is nutrient loading. Watersheds with greater proportions
of agricultural land use tend to discharge greater amounts of nitrogen and phosphorus
(Buck et al. 2004, Carpenter et al. 1998, Kronvang et al. 1995, Poor and
McDonnell 2007, Rekolainen 1989, Salvia-Castellvi et al. 2005, Shilling 2002).
Understanding factors influencing nutrient runoff is critical to understanding the
eutrophication of lakes, streams, estuaries, and coastal waters (Nixon 1995). In
aquatic systems, excess nutrient enrichment (i.e., eutrophication) can cause algal
blooms, a decrease in dissolved oxygen, fish kills, a decline in biodiversity,
a shift in aquatic plant communities, and other problems (e.g., impaired use of
water for drinking, agriculture, and recreation) (Carpenter et al. 1998).
Although numerous studies have assessed the impact of land-use practices on
biotic condition and water quality, few studies have focused on the southeastern
United States, where aquatic life is extremely diverse (Boschung and O’Neil
1981, Scott 2006, Walser and Bart 1999). The objective for this study was to
assess the relationship between land-use practices and water quality, habitat composition,
and fish assemblages within the Piedmont region of eastern Alabama.
Methods
Study area
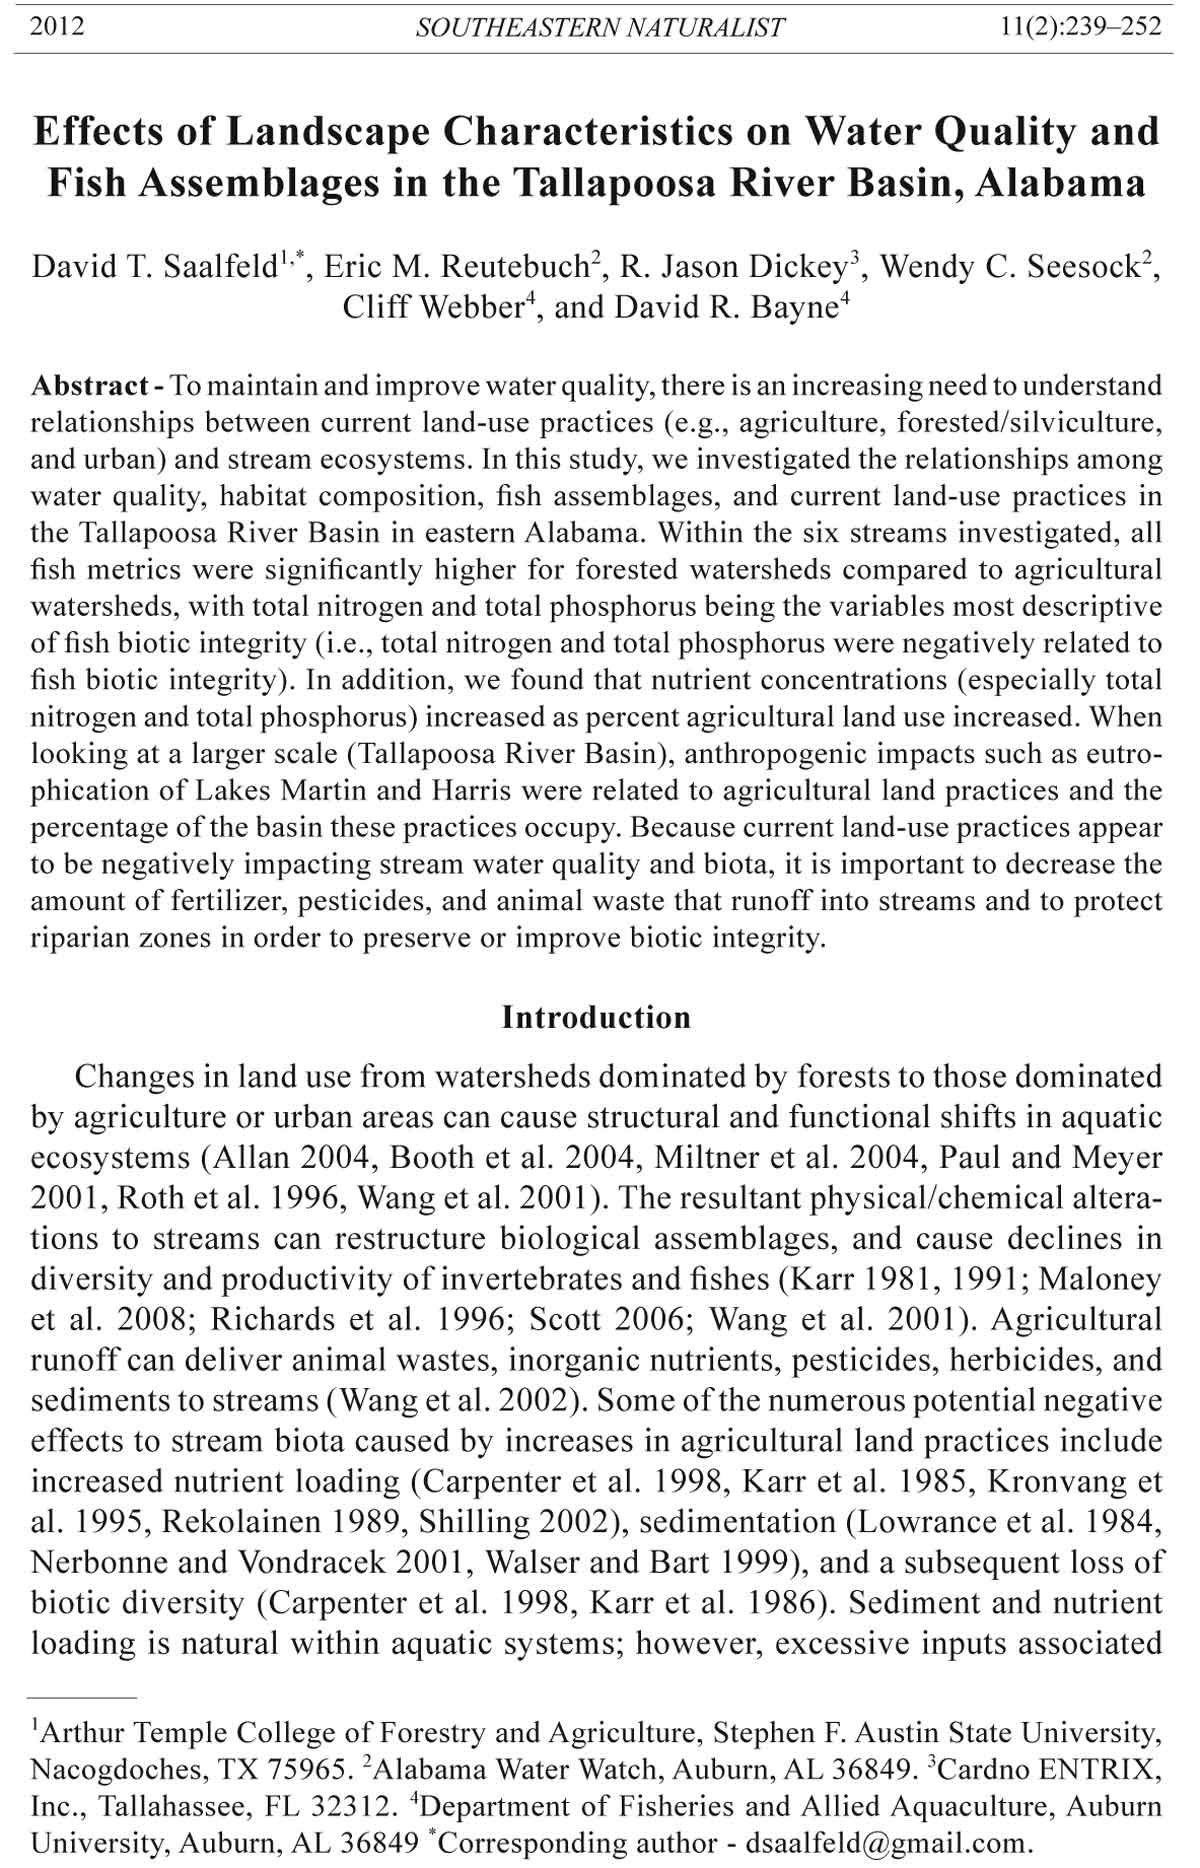
Sampling was conducted in six headwater (first and second order) streams
within the Upper and Middle Tallapoosa River sub-basins, AL, from February
2004–January 2006 (Fig. 1). All six streams lie within the Southern Inner
Piedmont Subecoregion of the Piedmont Ecoregion; which, in Alabama, generally
has higher elevations and more relief than the Coastal Plain to the south.
Streams were classified by the dominate land use (i.e., land use with the largest
area within a watershed) occupying their individual watersheds upstream from
sample sites. Streams were selected based on predominance of either forest/
Table 1. Watershed area, means (x̅), and standard errors (SE) for total alkalinity (TA), total nitrogen
(TN), total phosphorus (TP), and total suspended solids (TSS) for six stream sampled within the
Upper and Middle Tallapoosa River sub-basins, AL 2004–2006.
Watershed TA (mEq/l) TN (mg/l) TP (mg/l) TSS (mg/l)
Stream Land use area (ha) x̅ (SE) x̅ (SE) x̅ (SE) x̅ (SE)
Birdsong Creek Forest/silvicultureA 1386.1 6.29 (0.28) 0.25 (0.03) 0.02 (0.00) 4.38 (0.74)
Jones Creek Forest/silviculture 1191.0 6.38 (0.25) 0.27 (0.03) 0.02 (0.00) 7.38 (1.49)
Prairie Creek AgricultureB 1096.7 9.96 (0.36) 0.89 (0.05) 0.05 (0.89) 13.13 (2.21)
Rice Branch Agriculture 322.9 6.82 (0.27) 1.53 (0.07) 0.09 (0.02) 11.85 (4.54)
Grants Branch Agriculture 772.5 6.67 (0.25) 0.84 (0.08) 0.04 (0.01) 7.41 (1.93)
Pine Hill Creek Agriculture 254.6 9.00 (0.41) 2.41 (0.25) 0.13 (0.04) 13.90 (4.40)
AWatersheds classified as forest/silviculture were >90% forested/silviculture land use, including
clear cuts.
BWatersheds classified as agriculture were >33% agricultural land use.
2012 D.T. Saalfeld,et al. 241
silviculture or agricultural land use, because these two land-use types account for
the majority of the Upper and Middle Tallapoosa River sub-basins. Overall, forest/
silviculture and agricultural land uses dominated each of the six watersheds
(Table 1). Forest/silviculture sites consisted of clear cuts and areas dominated by
Pinus taeda L. (Loblolly Pine) at various stages of maturity. Agricultural sites
Figure 1. Location of study area streams within the Upper and Middle Tallapoosa River
sub-basins, AL.
242 Southeastern Naturalist Vol. 11, No. 2
were dominated by pastureland interspersed with forested land. Poultry-rearing
facilities were common throughout the agricultural watersheds, at varying densities.
It should be noted that litter from these facilities is valued as a nutrient-rich
fertilizer and commonly applied across pasturelands within the region, thus litter
from local poultry farms contributed to the environmental impacts from pastureland
(Alabama Soil and Water Conservation Committee 2007). An additional
nutrient input to pasturelands resulted from livestock grazing, primarily cattle.
Land-use classification
Land-use classifications were obtained for each of the six watersheds from the
Alabama GAP Analysis Program (Alabama Cooperative Fish and Wildlife Research
Unit 2001). An accuracy assessment was conducted by ground-truthing
numerous sites throughout the basin, resulting in an overall accuracy of 85% and a
Kappa Index accuracy of 80%. For our analyses, we combined the land-cover classes
into 1) forest/silviculture (combined coniferous, deciduous, and mixed classes),
2) urban, 3) agriculture/pasture, and 4) disturbed (clear-cuts, forest roads, etc.).
Size of each watershed upstream from our sampling site and the amount of impervious
surfaces (ha) were obtained through use of ArcHydro’s Watershed Delineation
Tool in ArcGIS 9.2 (Environmental Systems Research Institute, Redlands, CA).
Once the size and shape of each watershed was known, this layer was added to an
ArcGIS 9.2 file, where it was overlaid with the reclassified GAP land-use file. Once
these two files were overlaid, percent composition for each land-use classification
was obtained for all six watersheds.
Habitat sampling
Visual habitat assessments were conducted between November 2004 and
January 2005 at each stream site. No seasonal differences were detected in
water level or velocity, indicating habitat sampled during this time frame was
representative of the whole study period (Tallapoosa Watershed Project, unpubl.
data). Habitat variables were evaluated according to methods described in the
United States Environmental Protection Agency (US EPA) rapid bioassessment
protocols (Barbour et al. 1999, Plafkin et al. 1989). Habitat data collected within
each reach included instream (bottom substrate, available cover, embeddedness
of substrate material, and velocity/depth conditions), channel morphology (sediment
deposition, channel flow status, channel alteration, and pool/riffle ratio),
and riparian and bank structure (bank stability, bank vegetation, and riparian
cover) variables. All habitat variables were scored based on the rapid bioassessment
protocols, and the scores for each variable were summed to get an overall
habitat score for each stream.
Stream flow sampling
We obtained discharge measurements at all stations on a monthly basis to
define the stage-discharge relationship (rating) for each station. Flow measurements
were conducted through use of a Marsh-McBirney Flo-Mate® portable
velocity meter. Our measurements followed the two-point, six-tenths, and threepoint
methods, as described in the United States Geological Survey Techniques
2012 D.T. Saalfeld,et al. 243
of Water Resources Investigations (Buchanan and Somers 1969). As a general
rule, stream widths were divided into enough subsections so that no one subsection
contained more than five percent of the overall discharge. Typically, this
procedure resulted in 25–30 subsections measured at each stream transect.
Water quality sampling
A total of 36 water quality samples was collected at each stream (12 rain
events and 24 normal monthly samples) during February 2004–January 2006.
Temperature, dissolved oxygen, and specific conductance were measured in situ
at each station. Water grab-samples were collected mid-stream and mid-depth in
2-L Nalgene bottles. Upon collection, bottles were stored on ice in a cooler until
arrival at the laboratory for analysis. The following water quality variables were
measured in the Auburn University Limnology Laboratory: pH, total alkalinity,
total hardness, total phosphorus (TP), total nitrogen (TN), turbidity, and total
suspended solids (TSS). Standard analytical methods were followed for all variables,
and holding times were well within recommended limits (American Public
Health Association 1998).
Fish sampling
Fish assemblages were sampled at all stream sites during the winter of
2005 using a Coffelt Mark-10 portable backpack electrofishing unit powered
by a Honda EX350 generator. The backpack shocker consisted of a separate
anode connected to a pole held by the operator and a trailing rattail cathode. A
maximum of 4 to 5 amps was applied to stun and collect fish. Sampling occurred
between November and December, coincident with low stream flow, allowing for
more effective sampling (O’Neil et al. 2006). Electrofishing sites were selected
based on type and availability of habitat in each stream. Sections containing at
least three riffle-pool sequences were preferred. A 100-m section was cordoned
off using a 3-m seine with 3-mm mesh prior to electrofishing. Fish were captured,
enumerated, identified to species (using Boschung and Mayden 2004 and Mettee
et al. 1996), weighed (g), and measured (cm). Areas within the 100-m section that
were difficult to access with an electrofishing unit (e.g., undercut banks) were additionally
sampled with a 3-m kick seine (3-mm mesh) in order to alleviate bias
associated with preferential sampling.
Fish assemblages were compared using traditional structural indices including
species richness, species evenness (relative abundance), and Shannon-Wiener
diversity index (H'). In addition, a modified index of biotic integrity (IBI) developed
by O’Neil et al. (2006) for the Coosa and Tallapoosa Rivers, AL, was used
to further discern variations within and among fish assemblages in each stream.
The use of IBIs is well documented for detecting changes or status of fish assemblages
associated with human disturbances to aquatic ecosystems (Angermeier
and Karr 1986, Karr 1981, Karr et al. 1986).
Data analysis
Analysis of variance (ANOVA, PROC GLM; SAS Institute 2002) was used to
determine any differences in fish assemblages and water quality (total alkalinity,
244 Southeastern Naturalist Vol. 11, No. 2
TSS, TP, and TN) between dominant land-use classifications (forest/silviculture
and agriculture). An alpha level of 0.05 was used for these analyses, and least
squared means separation was used to examine differences. As no differences
were detected among years, water quality data were pooled in all analyses. Additionally,
simple linear regression (PROC REG; SAS Institute 2002) was used
to determine which water quality and habitat variable(s) were most strongly
related to fish assemblages. Fish IBI scores were used as the response variable
because they incorporate several biotic metrics into one value. For our candidate
set of models, we included all variables (percent land-use composition,
discharge, impervious surfaces, stream habitat, and water quality) individually,
where correlated variables were not permitted in the same model. To account for
the multi-colinearity among predictor variables, water quality (TP, TA, TSS, and
TP) and land-use variables (% forested/silviculture, % agriculture, % disturbed,
and % urban) were reduced into a smaller set of unrelated variables using principal
component analysis (PROC PRINCOMP; SAS Institute 2002). In addition,
simple linear regression models (PROC REG; SAS Institute 2002) were used to
determine which variables were most strongly related to water quality (TP, TN,
and TSS). For our candidate set of models, we included the following variables
individually: percent land-use composition, discharge, impervious surfaces, and
stream habitat. Akaike’s information criterion corrected for small sample size
(AICc) was used to rank the model(s), where models were considered plausible
if ΔAICc < 2 (Burnham and Anderson 2002).
Results
Mean concentrations of TN, TP, TSS, and total alkalinity were significantly
lower (P < 0.05) in forested/silviculture-dominated watersheds as compared
with watersheds dominated by agricultural land uses (Tables 1 and 2). Among
the population of 8 models developed for TP, the top-ranked model (AICw =
Table 2. Means ( x ), standard errors (SE), and P-values resulting from analysis of variance of
water quality and fish variables for forest/silviculture (n = 2 streams) and agriculture streams (n = 4
streams) located in the Upper and Middle Tallapoosa River sub-basins, AL, 2004–2006.
Forest/silviculture Agriculture
Variable x SE x SE P-value
Water quality
Total phosphorus 0.02 0.00 0.08 0.01 <0.001*
Total nitrogen 0.26 0.02 1.42 0.09 <0.001*
Total suspended solids 5.88 0.85 11.57 1.73 0.024*
Total alkalinity 6.33 0.19 8.11 0.20 <0.001*
Fish
IBI 44.00 2.00 31.00 2.52 0.031*
Species richness 16.25 0.75 16.33 2.43 0.983
Species evenness 0.75 0.09 0.71 0.07 0.787
Shannon-Wiener 2.03 0.24 1.92 0.22 0.775
*Significant P-value.
2012 D.T. Saalfeld,et al. 245
0.16) was the model containing percent agricultural land use (estimate = 0.04,
SE = 0.00; Table 3); however, the model containing percent forested/silviculture
land use (estimate = -0.08, SE = 0.00) was also considered plausible
(ΔAICc
= 1.40, AICw = 0.15; Table 3). Among the population of 8 models developed
for TN, the top-ranked model (AICw = 0.15) was the model containing
percent agricultural land use (estimate = 0.04, SE = 0.00; Table 3). Additionally,
from the suite of models tested for TN, the models containing percent
forested/silviculture land use (estimate = -0.07, SE = 0.00), percent disturbed
land use (estimate = 0.07, SE = 0.00), and percent impervious surfaces within
watershed (estimate = 7.63, SE = 0.13) were considered plausible (ΔAICc
<
2.00; Table 3). Among the population of 8 models developed for TSS, the topranked
model (AICw = 0.15) was the model containing stream habitat scores
(estimate = -0.13, SE = 0.65; Table 3); however, the model containing percent
Table 3. Model results for the linear regression models for estimating the influence of habitat
variables on water quality for six streams located within the Upper and Middle Tallapoosa River
sub-basins, AL, 2004–2006.
Model # of parameters ΔAICc
A AICw
B R2
Total phosphorus
% agriculture land use 2 0.00 0.16 0.884
% forest/silviculture land use 2 1.40 0.15 0.854
% disturbed land use 2 2.25 0.14 0.832
% impervious surfaces 2 4.91 0.13 0.738
Stream discharge 2 6.38 0.12 0.666
InterceptC 1 7.95 0.11 -
Stream habitat scores 2 10.35 0.10 0.352
% urban land use 2 11.50 0.09 0.212
Total nitrogen
% agriculture land use 2 0.00 0.15 0.832
% forest/silviculture land use 2 0.77 0.14 0.808
% impervious surfaces 2 1.32 0.14 0.790
% disturbed land use 2 1.62 0.14 0.780
Stream discharge 2 3.82 0.12 0.682
InterceptC 1 5.69 0.11 -
Stream habitat scores 2 7.92 0.10 0.369
% urban land use 2 9.39 0.09 0.195
Total suspended solids
Stream habitat scores 2 0.00 0.15 0.800
% forest/silviculture land use 2 0.09 0.15 0.797
% agriculture land use 2 2.45 0.14 0.699
InterceptC 1 4.65 0.12 -
% disturbed land use 2 5.10 0.12 0.532
% impervious surfaces 2 6.93 0.11 0.365
Stream discharge 2 7.64 0.10 0.285
% urban land use 2 7.67 0.10 0.281
ADifference between model’s Akaike’s information criterion corrected for small sample size and
the lowest AICc value.
BAICc relative weight attributed to model.
CModel with no effects added.
246 Southeastern Naturalist Vol. 11, No. 2
Table 4. Relative abundance of fish species collected from six streams located within the Upper and Middle Tallapoosa River sub-basins, AL, 2004–2006.
Rice Grants
Species Birdsong Jones Prairie Branch Branch Pine Hill
Ichthyomyzon gagei Hubbs and Trautman (Southern Brook Lamprey) 6.3 . . . . .
Campostoma oligolepis Hubbs and Greene (Largescale Stoneroller) 3.1 4.0 6.2 16.9 17.6 61.3
Cyprinella gibbsi Howell and Williams (Tallapoosa Shiner) 32.8 54.9 11.3 6.9 0.5 .
Cyprinella venusta Girard (Blacktail Shiner) . 3.5 . 1.3 1.0 .
Hybopsis lineapunctata Clemmer and Suttkus (Lined Chub) 8.9 2.5 . . . .
Luxilus chrysocephalus Rafinesque (Striped Shiner) 2.6 9.1 . . . .
Luxilus zonistius Jordan (Bandfin Shiner) . . 16.5 3.1 0.5 .
Nocomis leptocephalus Girard (Bluehead Chub) 8.9 6.1 7.2 5.0 2.0 2.7
Notropis baileyi Suttkus and Raney (Rough Shiner) 14.6 . . . 0.5 .
Notropis texanus Girard (Weed Shiner) . . . . 3.0 .
Semotilus atromaculatus Mitchill (Common Creek Chub) . 2.52 9.3 6.3 0.5 19.6
Hypentelium etowanum Jordan (Alabama Hog Sucker) 4.2 2.5 24.7 3.1 1.5 4.6
Ameiurus natalis Lesueur (Yellow Bullhead) . . . . . 0.2
Noturus funebris Gilbert and Swain (Black Madtom) 1.0 1.3 . 0.6 . 0.7
Fundulus bifax Cashner and Rogers (Stippled Studfish) 0.5 . . . . .
Fundulus olivaceus Storer (Blackspotted Topminnow) . . . 1.3 4.5 .
Ambloplites ariommus Viosca (Shadow Bass) . . . . . 0.2
Lepomis auritus L. (Redbreast Sunfish) 2.6 . 4.1 0.6 2.0 .
Lepomis cyanellus Rafinesque (Green Sunfish) . . 2.1 2.5 3.0 1.1
Lepomis macrochirus Rafinesque (Bluegill) . 1.0 2.1 0.6 32.2 0.9
Lepomis megalotis Rafinesque (Longear Sunfish) . 0.1 . . . 0.2
Micropterus coosae Hubbs and Bailey (Redeye Bass) 3.1 0.5 . . . .
Micropterus punctulatus Rafinesque (Spotted Bass) . . 1.0 . . .
Micropterus salmoides Lacepéde (Largemouth Bass) . . . . 2.5 .
Etheostoma tallapoosae Suttkus and Etnier (Tallapoosa Darter) 3.1 5.0 12.4 14.4 9.1 1.1
Percina kathae Thompson (Mobile Logperch) . . . . 2.0 .
Percina palmaris Bailey (Bronze Darter) . 1.5 . . 1.0 .
Percina smithvanizi Williams and Walsh (Muscadine Darter) 0.5 0.3 2.1 0.6 1.0 .
Cottus bairdii Girard (Mottled Sculpin) 7.8 5.3 1.0 36.9 15.6 7.3
2012 D.T. Saalfeld,et al. 247
forested/silviculture land use (estimate = -0.32, SE = 0.08) was also considered
plausible (ΔAICc
= 0.08, AICw = 0.15; Table 3).
A total of 1484 fish representing 30 species was collected (see Table 4 for
summary of species collected by stream and Table 5 for summary of metrics [i.e.,
IBI, species richness, species evenness, and Shannon-Wiener diversity index] by
stream). IBI scores for forested/silviculture streams were significantly higher than
those for agricultural streams (F1, 5 = 10.73, P = 0.031; Fig. 2, Table 2). Species
richness, evenness, and Shannon-Wiener diversity index were similar among forested/
silviculture and agricultural streams (P > 0.05; Table 2). The first principal
component was retained for both water quality and land use, explaining > 81% of
the variation. TP, TN, and TSS highly loaded on the first water-quality principal
component (eigenvector > 0.52 for all three variables), while % forested/silviculture,
% agriculture, and % disturbed highly loaded on the first land-use principal
component (eigenvector > 0.52 for all three variables). Among the population of
23 models for fish IBI scores, the top-ranked model (AICw = 0.10) was the model
containing the first principal component of water quality variables (estimate =
-2.51, SE = 0.45; Table 6). From the suite of models tested, the models containing
TP (estimate = -7.76, SE = 0.86), TN (estimate = -8.94, SE = 1.67), percent
forested/silviculture land use (estimate = 0.69, SE = 0.38), TSS (estimate = -1.92,
SE = 0.13), principal component of land use (estimate = 0.32, SE = 0.07), and
percent agricultural land use (estimate = -0.34, SE = 0.76) were also considered
plausible (ΔAICc
< 2; Table 6).
Discussion
Numerous studies have documented declines in water quality, habitat, and
biological assemblages as the extent of agricultural land increases within a
watershed (Delong and Brusven 1998, Richards et al. 1996, Roth et al. 1996,
Sponseller et al. 2001). Among sampled watersheds, we found that streams with
a high percentage of agricultural land use consistently yielded lower IBI scores
for fish assemblages than forested/silviculture-dominated streams. These lower
scores were attributable to having fewer lithophilic spawners, fewer invertivores,
a greater percentage of omnivores, and a higher diversity of tolerant species.
A decline in lithophilic spawners is typical in streams affected by siltation as
Table 5. Fish metrics (IBI, species evenness, species richness, Shannon-Weiner diversity index, and
total number of fish collected) for six streams sampled within the Upper and Middle Tallapoosa
River sub-basins, AL, 2004–2006.
Species Species Shannon- Total
Stream IBI evenness richness Wiener individual
Birdsong 46 0.83 17 2.26 192
Jones 42 0.66 16 1.79 397
Prairie 32 0.86 14 2.20 97
Rice Branch 32 0.74 19 2.00 160
Grants Branch 36 0.74 22 2.19 199
Pine Hill 24 0.51 12 1.27 439
248 Southeastern Naturalist Vol. 11, No. 2
increased sediment from the watershed smothers necessary reproductive habitat
(e.g., cobble, gravel) leading to a reduction in habitat complexity (Allan et al.
1997, Walser and Bart 1999). The lack of invertivore diversity, and associated
increase in omnivory, are also consistent with substrate depreciation, as benthic
foragers are replaced by more generalized feeders. Similarly, our results showed
that total suspended solids were nearly twice as high, on average, in the agricultural
streams compared to the forested/silviculture streams.
With the decrease in stone substrate associated with increased siltation, fish
diversity could also be influenced by the invasion of cosmopolitan species (i.e.,
fishes in the Family Centrarchidae). This trend is consistent with the higher
percentage of omnivores collected in the agriculture streams relative to species
composition of the reference stream (Birdsong Creek), where fish species composition
consisted mostly of invertivores and carnivores. Additionally, because
Figure 2. Index of Biotic Integrity (IBI) score for fish by percentage of forested land
cover within each stream’s watershed contained by the Upper and Middle Tallapoosa
River sub-basins, AL, 2004–2006.
2012 D.T. Saalfeld,et al. 249
of significantly higher nutrient levels in the agriculture streams, eutrophication
may be contributing to the colonization of more cosmopolitan species and the
reduction in IBI scores for these streams.
TN and TP concentrations were also appreciably higher in the agricultural
streams than in the forested/silviculture systems, and were strongly related to
fish IBI scores. This finding may have been attributable to increased periphyton
biomass often associated with high levels of nitrogen and phosphorus. Periphyton
biomass was not examined during this study, but may offer a link between
increased nutrients (nitrogen and phosphorus) and lower IBI scores, particularly
with respect to feeding guilds. Whether from animal manure or fertilizer applications,
agricultural watersheds are typified by having increased inputs of
nutrients (Allan 2004). In our study, nutrient inputs to agricultural watersheds
were primarily from grazing livestock (manure) and poultry houses (litter spread
on pastureland). The high levels of TN, TP, and TSS documented in agricultural
streams may also be attributed to the lack of adequate riparian cover, which
allows for increased runoff to enter unimpeded and unassimilated.
Table 6. Linear regression models for water quality and habitat variables predicting fish IBI
scores from six streams located within the Upper and Middle Tallapoosa River sub-basins, AL,
2004–2006.
# of
Model parameters ΔAICc
A AICw
B R2
Water quality PC1C 2 0.00 0.10 0.888
Total phosphorus 2 0.02 0.10 0.888
Total nitrogen 2 0.53 0.06 0.878
% forest/silviculture land use 2 0.83 0.06 0.871
Total suspended solids 2 1.00 0.06 0.868
Land use PC1 2 1.58 0.06 0.854
% agriculture land use 2 1.75 0.06 0.850
% disturbed land use 2 4.43 0.05 0.765
Water quality PC1 + % impervious surfaces 3 5.34 0.05 0.948
% impervious surfaces 2 5.58 0.05 0.646
Stream habitat scores 2 7.86 0.04 0.585
Water quality PC1 + stream discharge 3 7.93 0.04 0.921
Land use PC1 + % impervious surfaces 3 7.97 0.04 0.920
InterceptD 1 8.14 0.04 -
Land use PC1 + stream habitat scores 3 8.23 0.04 0.917
Total alkalinity 2 8.84 0.04 0.511
Stream discharge 2 10.08 0.03 0.399
Land use PC1 + stream discharge 3 11.58 0.03 0.854
% urban land use 2 12.18 0.03 0.148
Land use PC1 + % impervious surfaces + stream habitat scores 4 32.25 0.00 0.935
Water quality PC1 + % impervious surfaces + stream discharge 4 34.99 0.00 0.951
Land use PC1 + % impervious surfaces + stream discharge 4 36.71 0.00 0.935
Land use PC1 + stream discharge + stream habitat scores 4 37.65 0.00 0.924
ADifference between model’s Akaike’s information criterion corrected for small sample size and
the lowest AICc value.
BAICc relative weight attributed to model.
CPC1 = first principal component
DModel with no effects added.
250 Southeastern Naturalist Vol. 11, No. 2
Within the six streams/watersheds that we sampled, increases in nutrients
measured (TP and TN), sedimentation (TSS), and percentage of agricultural
land were associated with decreases in fish biotic integrity. Many studies have
shown similar results, but few have looked at a watershed with as diverse a biotic
community as the Tallapoosa River Basin. In order to reduce anthropogenic influences
on streams, it is necessary to decrease sedimentation and nutrient loading
from urban and agriculture land uses. There exist a myriad of best management
practices (BMPs) aimed at reducing such pollutants. Generally silviculture operations
are under more pressure, both legally and publicly, to incorporate BMPs
than are small to medium-sized farms, though there are many government incentive
programs that exist to aid farmers in managing their land more responsibly.
One example of an effective BMP is the creation of forested riparian buffer zones
(or streamside management zones). We observed that these zones were intact in
the forested/silviculture watersheds and degraded or absent in the agricultural
watersheds, where cattle had access to riparian areas. Un-impacted riparian vegetation
reduces the amount of nitrogen, phosphorus, and sediment that reaches the
stream. At a larger scale (Tallapoosa River Basin), anthropogenic impacts from
agricultural lands that lack proper BMPs may be manifested as eutrophication of
downstream reservoirs. Decreasing the amount of manure fertilizer, pesticides,
and grazing that occurs in proximity to streams (especially on pasturelands with
significant slopes) and preserving stream riparian zones should improve biotic
integrity in agricultural streams, which will translate to less nutrient impacts in
the Lower Tallapoosa sub-basin.
Acknowledgments
Financial, logistical, and technical support for the stream water quality sampling was
provided by the United States Department of Agriculture Cooperative State Research,
Education, and Extension Service as part of the Tallapoosa Watershed Project, a threeyear
integrated project focused on research, education, and outreach. Financial, logistical,
and technical support for the fish sampling was provided by the Middle Tallapoosa River
Basin Clean Water Partnership, Lake Wedowee Property Owners Association, and Auburn
University Environmental Institute. Financial support for publishing was provided
by the Auburn University Water Resources Center. We also thank all the individuals that
assisted with data collection for this research project.
Literature Cited
Alabama Cooperative Fish and Wildlife Research Unit. 2001. Available online at www.
auburn.edu/gap. Accessed January 2005.
Alabama Soil and Water Conservation Committee. 2007. Alabama watershed assessment.
Available online at http://swcc.alabama.gov/pages/watershed.aspx?sm=b_a.
Accessed January 2009.
Allan, J.D. 2004. Landscapes and riverscapes: The influence of land use on stream ecosystems.
The Annual Review of Ecology, Evolution, and Systematics 35:257–284.
Allan, J.D., D.L. Erickson, and J. Fay. 1997. The influence of catchment land use on
stream integrity across multiple spatial scales. Freshwater Biology 37:149–161.
2012 D.T. Saalfeld,et al. 251
Angermeier, P.L., and J. R. Karr. 1986. Applying an index of biotic integrity on streamfi
sh communities: Considerations in sampling and interpretation. North American
Journal of Fisheries Management 6:418–429.
American Public Health Association. 1998. Standard Methods for the Examination of
Water and Wastewater. 20th Edition. American Public Health Association, Washington,
DC. 1220 pp.
Barbour, M.T., J. Gerritsen, B.D. Snyder, and J.B. Stribling. 1999. Rapid Bioassessment
Protocols for Use in Streams and Wadeable Rivers: Periphyton, Benthic Macroinvertebrates,
and Fish. Second Edition. EPA 841-B-99-002. US Environmental Protection
Agency Office of Water, Washington, DC.
Booth, D.B., J.R. Karr, S. Schauman, C.P. Konrad, S.A. Morley, M.G. Larson, and S.J.
Burges. 2004. Reviving urban streams: Land use, hydrology, biology, and human behavior.
Journal of the American Water Resources Association 40:1351–1363.
Boschung, H.T., and R.L. Mayden. 2004. Fishes of Alabama. Smithsonian Institution,
Washington, DC. 736 pp.
Boschung, H., and P. O’Neil. 1981. The effects of forest clear-cutting on fishes and macroinvertebrates
in an Alabama stream. Pp. 200–217, In L.A. Krumholz, G.D. Pardue,
and G.A. Hall (Eds.). Proceedings of the Warmwater Streams Symposium. Southern
Division of the American Fisheries Society, Bethesda, MD.
Buchanan, T.J., and W.P. Somers. 1969. Discharge measurement at gaging stations. Pp.
31–40, In Techniques of Water Resources Investigations of the United States Geological
Survey. US Government Printing Office, Washington, DC.
Buck, O., D.K. Niyogi, and C.R. Townsend. 2004. Scale-dependence of land-use effects
on water quality of streams in agricultural catchments. Environmental Pollution
130:287–299.
Burnham, K.P., and D. R. Anderson. 2002, Model Selection and Multimodal Inference: A
Practical Information-theoretical Approach. Springer, New York, NY. 488 pp.
Carpenter, S.R., N.F. Caraco, D.L. Correll, R.W. Howarth, A.N. Sharpley, and V.H.
Smith. 1998. Nonpoint pollution of surface waters with phosphorus and nitrogen.
Ecological Applications 8:559–568.
Delong, M.D., and M.A. Brusven. 1998. Macroinvertebrate community structure along
the longitudinal gradient of an agriculturally impacted stream. Environmental Management
22:445–457.
Karr, J.R. 1981. Assessment of biotic integrity using fish communities. Fisheries
6(6):21–27.
Karr, J.R. 1991. Biological integrity: A long-neglected aspect of water resource management.
Ecological Applications 1:66–84.
Karr, J.R., L.A. Toth, and D.R. Dudley. 1985. Fish communities of Midwestern rivers: A
history of degradation. Bioscience 35:90–95.
Karr, J.R., K.D. Fausch, P.L. Angermeier, P.R. Yant, and I.J. Schlosser. 1986. Assessing
biological integrity in running waters: A method and its rationale. Illinois Natural
History Survey Special Publication 5, Champaign, IL. 31 pp.
Kronvang, B., R. Grant, S.E. Larsen, L.M. Svedsen, and P. Kristensen. 1995. Non-pointsource
nutrient losses to the aquatic environment in Denmark: Impact of agriculture.
Marine and Freshwater Research 46:167–177.
Lowrance, R., R. Todd, J.J. Fail., J.O. Hendrickson., R. Leonard, and L. Asmussen.
1984. Riparian forests as nutrient filters in agricultural watersheds. Bioscience
34:374–377.
Maloney, K.O., J.W. Feminella, R.M. Mitchell, S.A. Miller, P.J. Mulholland, and J.N.
Houser. 2008. Landuse legacies and small streams: Identifying relationships between
historical land use and contemorary stream conditions. Jounal of the North American
Benthological Society 27:280–294.
252 Southeastern Naturalist Vol. 11, No. 2
Mettee, M.F., P.E. O’Neil, and J.M. Pierson. 1996, Fishes of Alabama and the Mobile
Basin. Oxmoor House, Inc., Birmingham, AL. 820 pp.
Miltner, R.J., D. White, and C.O. Yoder. 2004. The biotic integrity of streams in urban
and suburbanizing landscapes. Landscape and Urban Planning 69:87–100.
Nerbonne, B.A., and B. Vondracek. 2001. Effects of local land use on physical habitat,
benthic macroinvertebrates, and fish in the Whitewater River, Minnesota, USA. Environmental
Management 28:87–99.
Nixon, S.W. 1995. Coastal marine eutrophication: A definition, social concerns, and future
concerns. Ophelia 41:199–219.
O’Neil, P.E., T.E. Shepard, and M.R. Cook. 2006. Habitat and Biological Assessment of
the Terrapin Creek Watershed and Development of the Index of Biotic Integrity for
the Coosa and Tallapoosa River Systems. Geological Survey of Alabama, Tuscaloosa,
AL. 211 pp.
Paul, M.J., and J.L. Meyer. 2001. Streams in the urban landscape. Annual Review in
Ecology and Systematics 32.
Plafkin, J.L., M.T. Barbour, K.D. Porter, S.K. Gross, and R.M. Hughes. 1989. Rapid bioassessment
protocols for use in streams and rivers: Benthic macroinvertebrates and
fish. EPA 444-4-89-001. US Environmental Protection Agency, Washington, DC.
Poor, C.J., and J.J. McDonnell. 2007. The effects of land use on stream nitrate dynamics.
Journal of Hydrology 332:54–68.
Rekolainen, S. 1989. Phosphorus and nitrogen load from forest and agricultural areas in
Finland. Aqua Fennica 19:95–107.
Richards, C., L.B. Johnson, and G.E. Host. 1996. Landscape-scale influences on stream
habitats and biota. Canadian Journal of Fisheries and Aquatic Sciences 53:295–311.
Roth, N.E., J.D. Allan, and D.L. Erickson. 1996. Landscape influences on stream biotic
integrity assessed at multiple spatial scales. Landscape Ecology 11:141–156.
Salvia-Castellvi, M., J.F. Iffly, P.V. Borght, and L. Hoffman. 2005. Dissolved and particulate
nutrient export from rural catchments: A case study from Luxembourg. Science
of the Total Environment 344:1184–1193.
SAS Institute. 2002. SAS/STAT software,Version 9. SAS Institute Inc, Cary, NC.
Scott, M.C. 2006. Winners and losers among stream fishes in relation to land-use
legacies and urban development in the southeastern US. Biological Conservation
127:301–309.
Shilling, K.E. 2002. Chemical transport from paired agricultural and restored prairie
watersheds. Journal of Environmental Quality 31:1184–1193.
Sponseller, R.A., E.F. Benfield, and H.M. Valett. 2001. Relationships between land
use, spatial scale, and stream macroinvertebrate communities. Freshwater Biology
46:1409–1424.
Walser, C.A., and H.L. Bart, Jr. 1999. Influence of agriculture on in-stream habitat and
fish community structure in Piedmont watersheds of the Chattahoochee River system.
Ecology of Freshwater Fish 8:237–246.
Wang, L., J. Lyons, P. Kanehl, and R. Bannerman. 2001. Impacts of urbanization on
stream habitat and fish across multiple spatial scales. Environmental Management
28:255–266.
Wang, L., J. Lyons, and P. Kanehl. 2002. Effects of watershed best management practices
on habitat and fish in Wisconsin streams. Journal of the American Water Resources
Association 38:663–680.


 The Southeastern Naturalist is a peer-reviewed journal that covers all aspects of natural history within the southeastern United States. We welcome research articles, summary review papers, and observational notes.